We are at the 7th Central German Meeting on Bioinformatics (also known as Mittelerde) in Halle from 26/03/2026 to 27/03/2026! Sebastian will hold a keynote about small molecule machine learning. Fleming will talk about retention time prediction. Nils, Andres, Leopold and Jonas will have posters to come and look at during the poster session.
Small server downtimes at the 24th and 25th
On the 24th and 25th of November 2025, our website and our Mattermost instance will be unavailable for multiple hours.
Estimated downtimes are:
- Mo, 24. November: 13-17
- Tue, 25. November: 15-19
Our barcode-free screening platform for early drug discovery appeared in Nature Communications
Our paper “Barcode-free hit discovery from massive libraries enabled by automated small molecule structure annotation” has finally been published in Nature Communications. This first publication from our joint project with Sebastian Pomplun (Leiden University and Oncode Institute) presents a barcode-free self-encoded library (SEL) platform that enables the screening of over half a million small molecules in a single experiment. Kudos to Sebastian Pomplun and his PhD student Edith van der Nol, and of course to all co-authors!
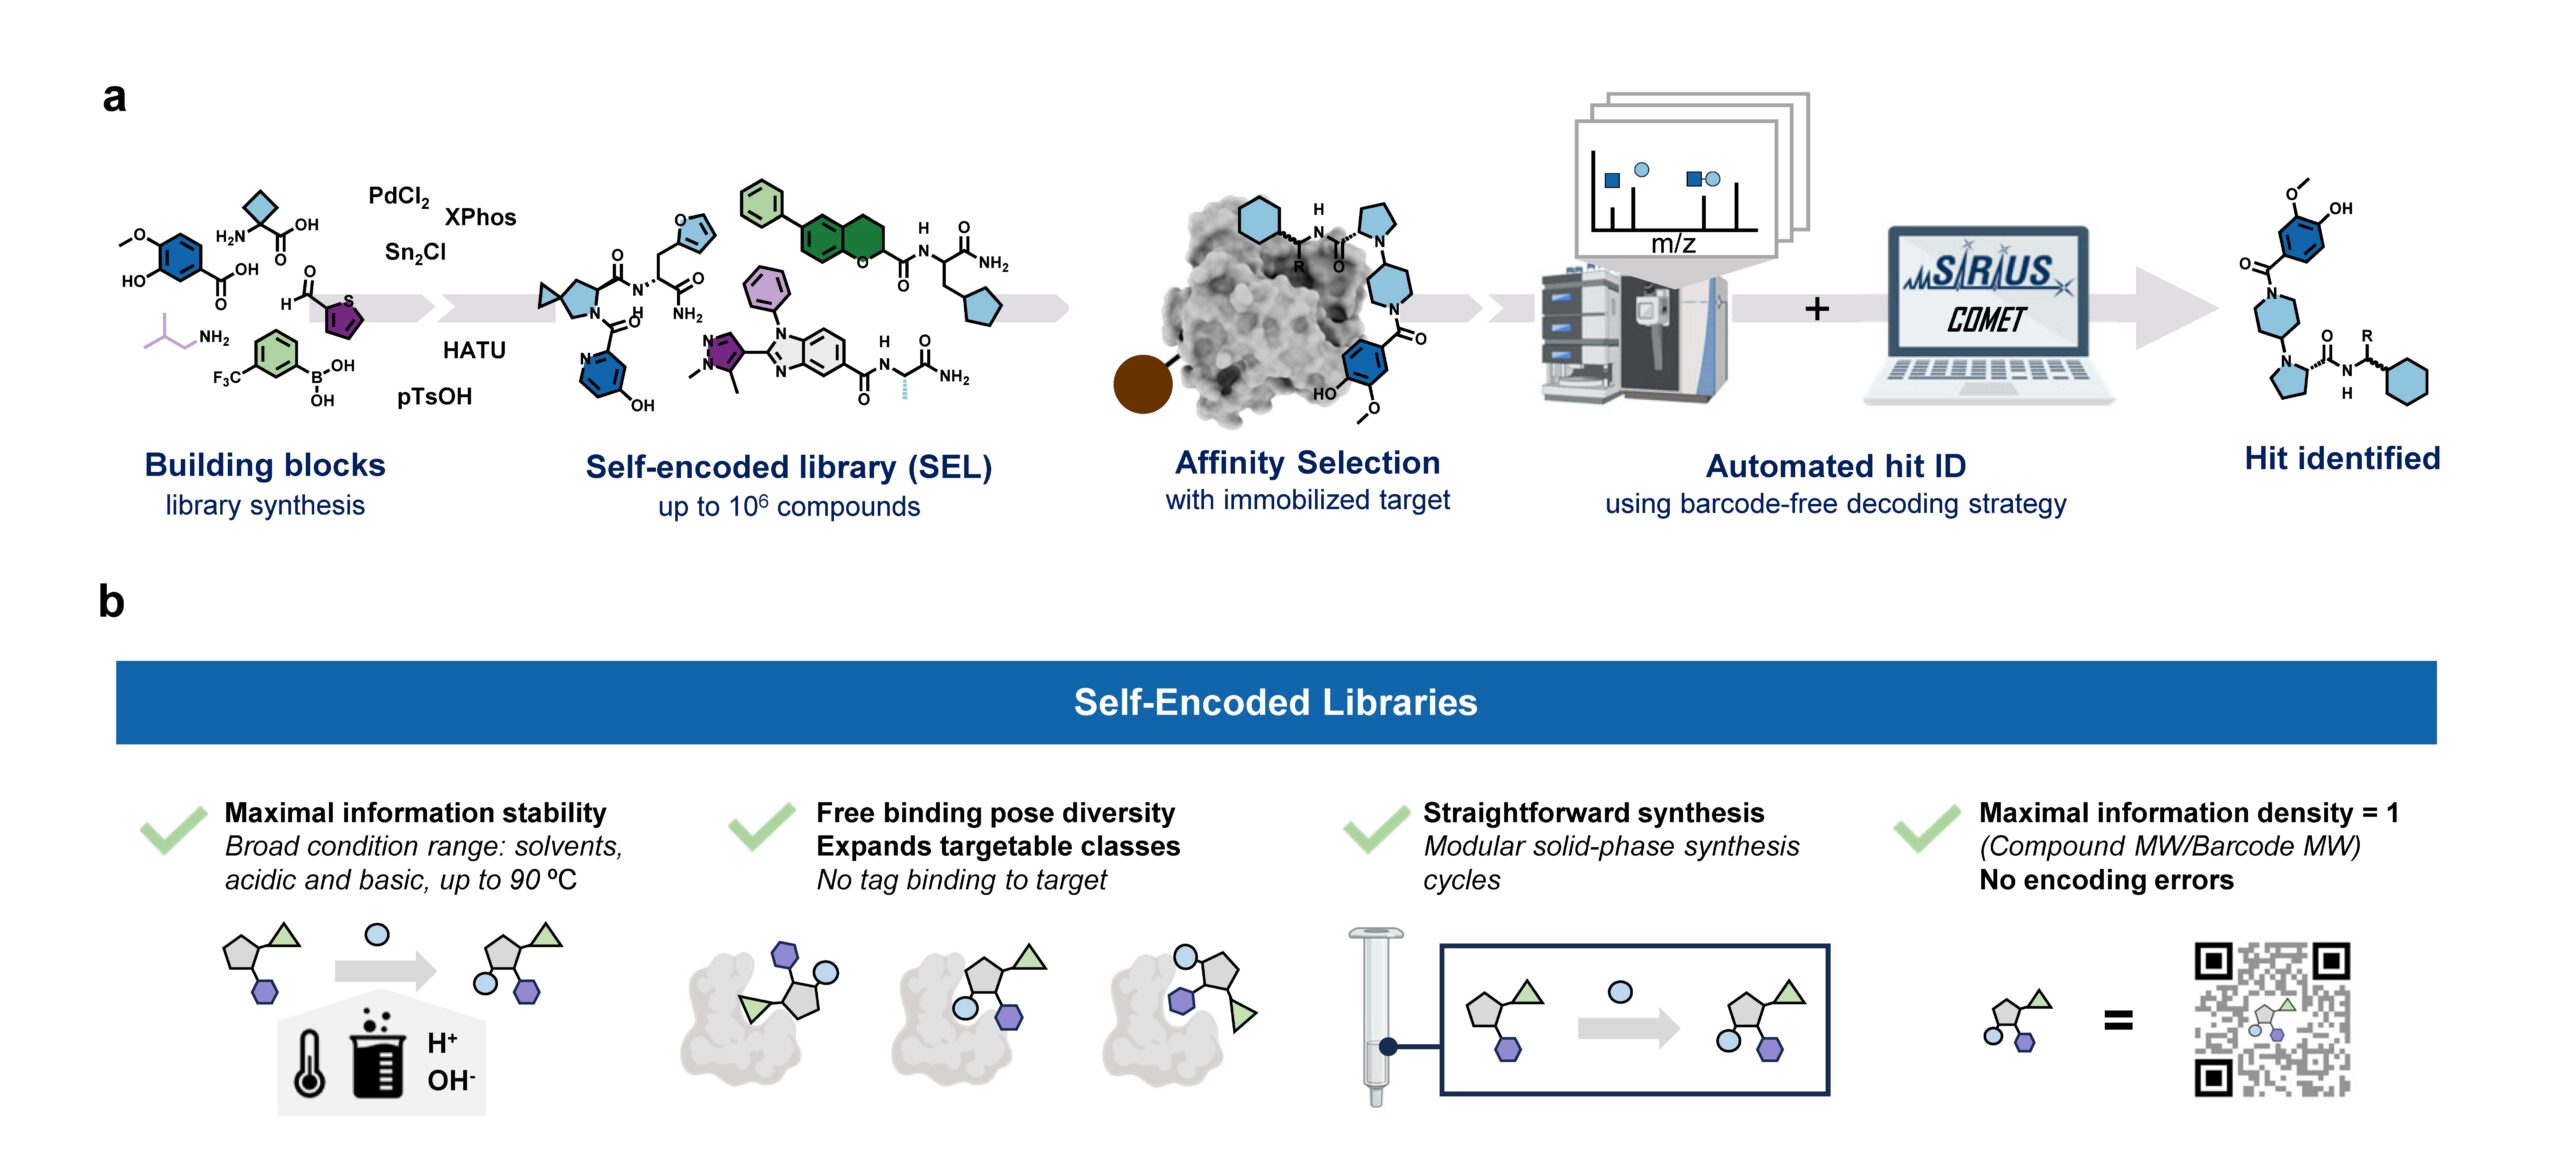
In general, discovering new pharmacologically active molecules that bind to a certain drug target is a tedious process as it requires the screening of very large compound libraries. In contrast to traditional high-throughput methods, affinity selection (AS) represents a powerful approach that allows the rapid screening of millions of molecules in just a single experiment. Here, the compound library is incubated with the receptor of interest, and in a following step, binders are separated from non-binders. This results in a final sample containing ideally only the binders which are called hits.
At this stage of the workflow, we know that this sample represents a subset of our initial screening library, but we do not know which molecules are actually in there. Therefore, the challenge remains in the identification of these hit compounds. This is most commonly done by initially attaching unique DNA barcodes to the molecules of the screening library, which can then be sequenced to identify the isolated hits. However, one of the fundamental drawbacks of these DNA-encoded libraries (DELs) is the potential interference of the attached tag during the affinity selection. This limitation becomes particularly problematic when the target protein has nucleic acid binding sites, making the screening against targets like transcription factors extremely difficult.
Consequently, an approach that does not require any tag while still allowing the simultaneous screening of a vast number of compounds is highly desirable. That is why our screening platform is based on affinity selection-mass spectrometry (AS-MS), which relies solely on MS to identify the selected hit compounds, eliminating the need for any tags. Thus, the name self-encoded libraries (SELs). Since our platform also features the use of split-&-pool libraries, containing potentially millions or even billions of combinatorially synthesized molecules, the monoisotopic mass alone is insufficient for the identification, and tandem mass spectrometry (MS/MS) has to be used instead. Therefore, we present a computational workflow, called COMET, for analyzing the acquired LC-MS/MS data and enabling the identification of the isolated hit compounds. Although the final AS sample contains only up to a few hundreds compounds, we observed that the corresponding LC-MS/MS data mainly contained features resulting from background noise, which usually lead to a large number of false-positive annotated compounds. We therefore implemented a filter into COMET that removes all features that do not match a genuine library molecule, either due to a non-matching precursor mass or fragmentation pattern.
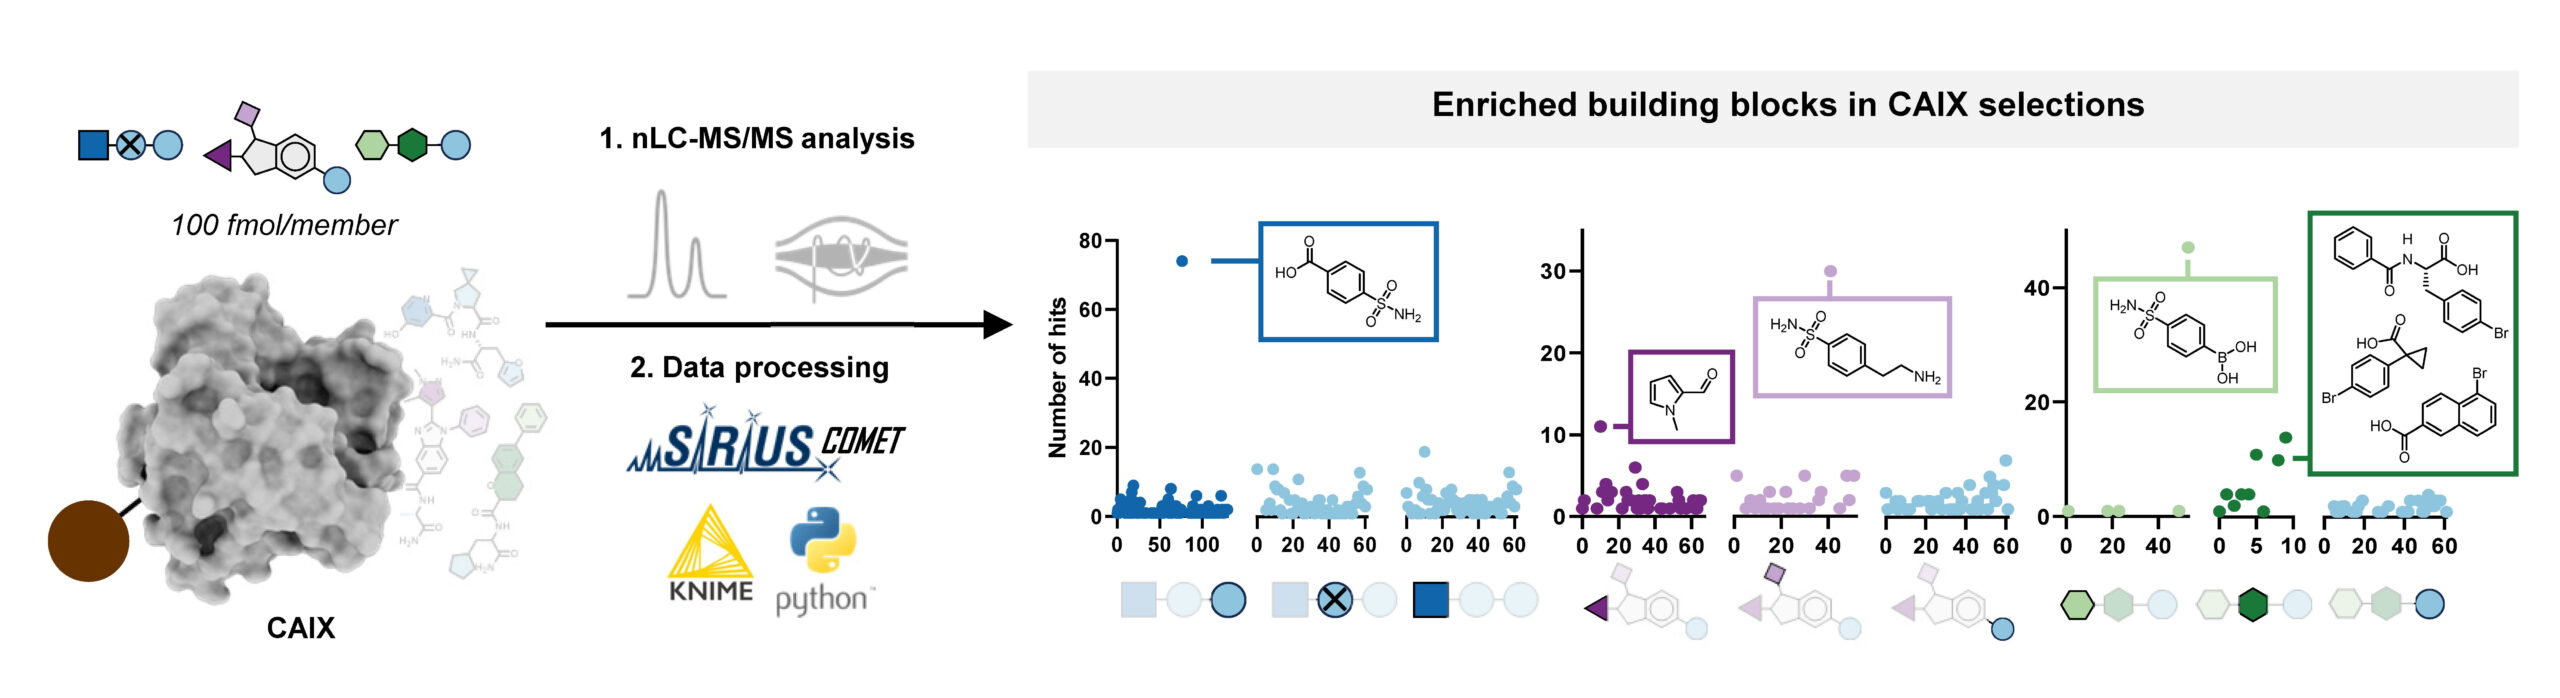
With this workflow in hand, Edith synthesized three combinatorial molecule libraries containing up to 750,000 compounds and incubated them separately with carbonic anhydrase IX (CAIX), a target typically used to benchmark novel DNA-encoded libraries. All three AS-MS experiments resulted in the identification of hit compounds containing a sulfonamide building block, which aligns well with the literature about known CAIX binders. Subsequent validation confirmed these hits’ binding affinity to CAIX, demonstrating the effectiveness of our screening platform.
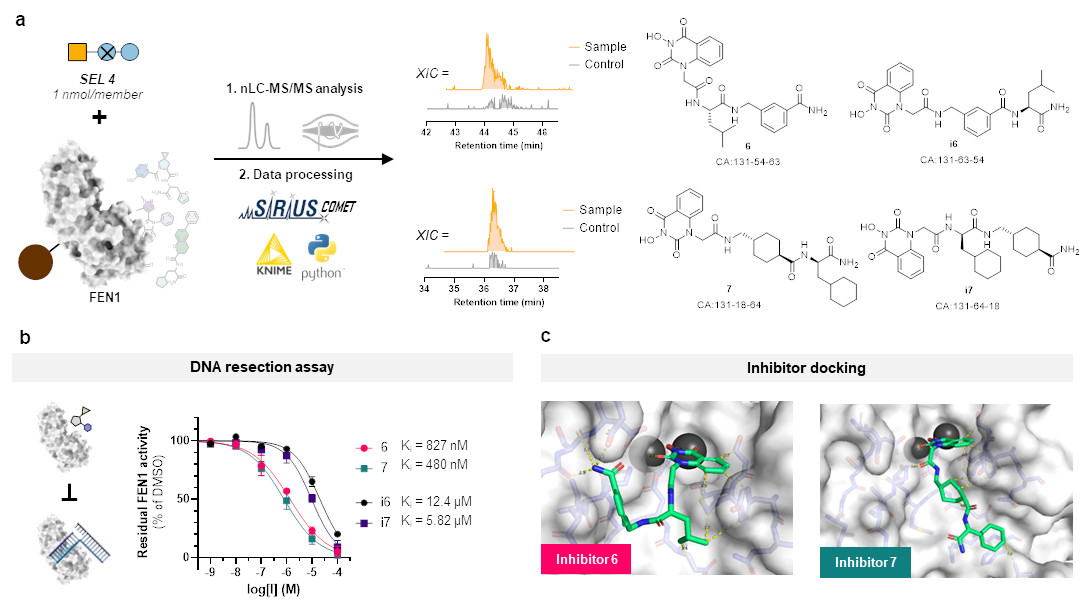
But this represents more or less only a sanity check and does not clearly show the advantage of our SEL platform compared to DELs. So, we chose a target protein which is beyond the scope of DELs: flap endonuclease 1 (FEN1), a DNA-processing enzyme essential for replication and repair, and over-expressed in multiple cancer types. For this challenging target, we synthesized a new, more focused library comprising 4,000 members after determining that our previous libraries were insufficient for clear hit identification. This approach successfully yielded four hits, all of which demonstrated inhibitory activity against FEN1.
All in all, our SEL-COMET workflow represents a rapid, barcode-free screening approach for early drug discovery, and we hope that this approach will be widely adopted in both academic and industrial research settings.
PhD and postdoc positions within the ERC project BindingShadows are still open
Update: This posting is now closed. Thank you for your interest.
A quick reminder: The PhD and postdoc positions within the ERC project BindingShadows are still open!
We’ve just moved into a brand-new building, and during the transition our servers and website were occasionally down, meaning we might not have received some applications. So once again: if you’re skilled in bioinformatics and/or machine learning, and you’re excited about developing innovative computational methods for analyzing small molecule mass spec data, please apply! The project is based in Jena, Germany, and will run for five years. At least two postdoctoral and two PhD positions are available. For questions, feel free to contact us — and please share this with anyone who might be interested. Thank you!
We finally moved!
We moved! After several weeks of home office, we finally moved into our brand-new building!
Apologies for the occasional downtime of our servers and website over the past two months. Everything is back up and should run smoothly from now on!


Website and Mattermost will be down again on 20th and 21st
On the 20th and 21st of October 2025, our website and our Mattermost instance will not be available. This is due to stress testing of the compute infrastructure at our new building. The SIRIUS services like CSI:FingerID will stay up and running. We hope to be back at full operation on Wednesday and should stay up from then on!
We are back
After three weeks, our web server (and many other things) are back online. We made sure that CSI:FingerID etc are up and running, but somehow forgot that there is more than that. Sorry in case this caused any troubles.
Bioinformatische Methoden in der Genomforschung im WiSe 25/26
Im kommenden Wintersemester 2025/2026 wird wieder das Modul Bioinformatische Methoden in der Genomforschung angeboten. Im Sommersemester 2026 wird dann wieder das Modul Sequenzanalyse zu hören sein.
Retention time prediction is dead, long live retention order index prediction!
We just solved a problem that I never wanted to solve: That is, transferable retention time prediction of small molecules. They say that the best king is someone who does not want to be king; so maybe, the best problem solver is someone who does not want to solve the problem? Not sure about that. (My analogies have been quite monarchist lately; we are watching too much The Crown.)
What is transferable retention time prediction? Let’s assume you tell me some details about your chromatographic setup. We are talking about liquid, reversed-phase chromatography. You tell me what column you use, what gradient, what pH, maybe what temperature. Then, you say “3-Ketocholanic acid” and I say, “6.89 min”. You say “Dibutyl phthalate”, I say “7.39 min”. That’s it, folks. If you think that is not possible: Those are real-world examples from a biological dataset. The true (experimentally measured) retention times where 6.65 min and 7.41 min.
Now, you might say, “but how many authentic standards were measured on the same chromatographic setup so that you could do your predictions”? Because that is how retention time prediction works, right? You need authentic standards measured on the same system so that you can do predictions, right? Not for transferable retention time prediction. For our method, the answer to the above question is zero, at least in general. For the above real-world example, the answer is 19. Nineteen. In detail, 19 NAPS (N-Alkylpyridinium 3-sulfonate) molecules were measured in an independent run. Those standards were helpful, but we could have done without them. If you know a bit about retention time prediction: There was no fine-tuning of some machine learning model on the target dataset. No, sir.
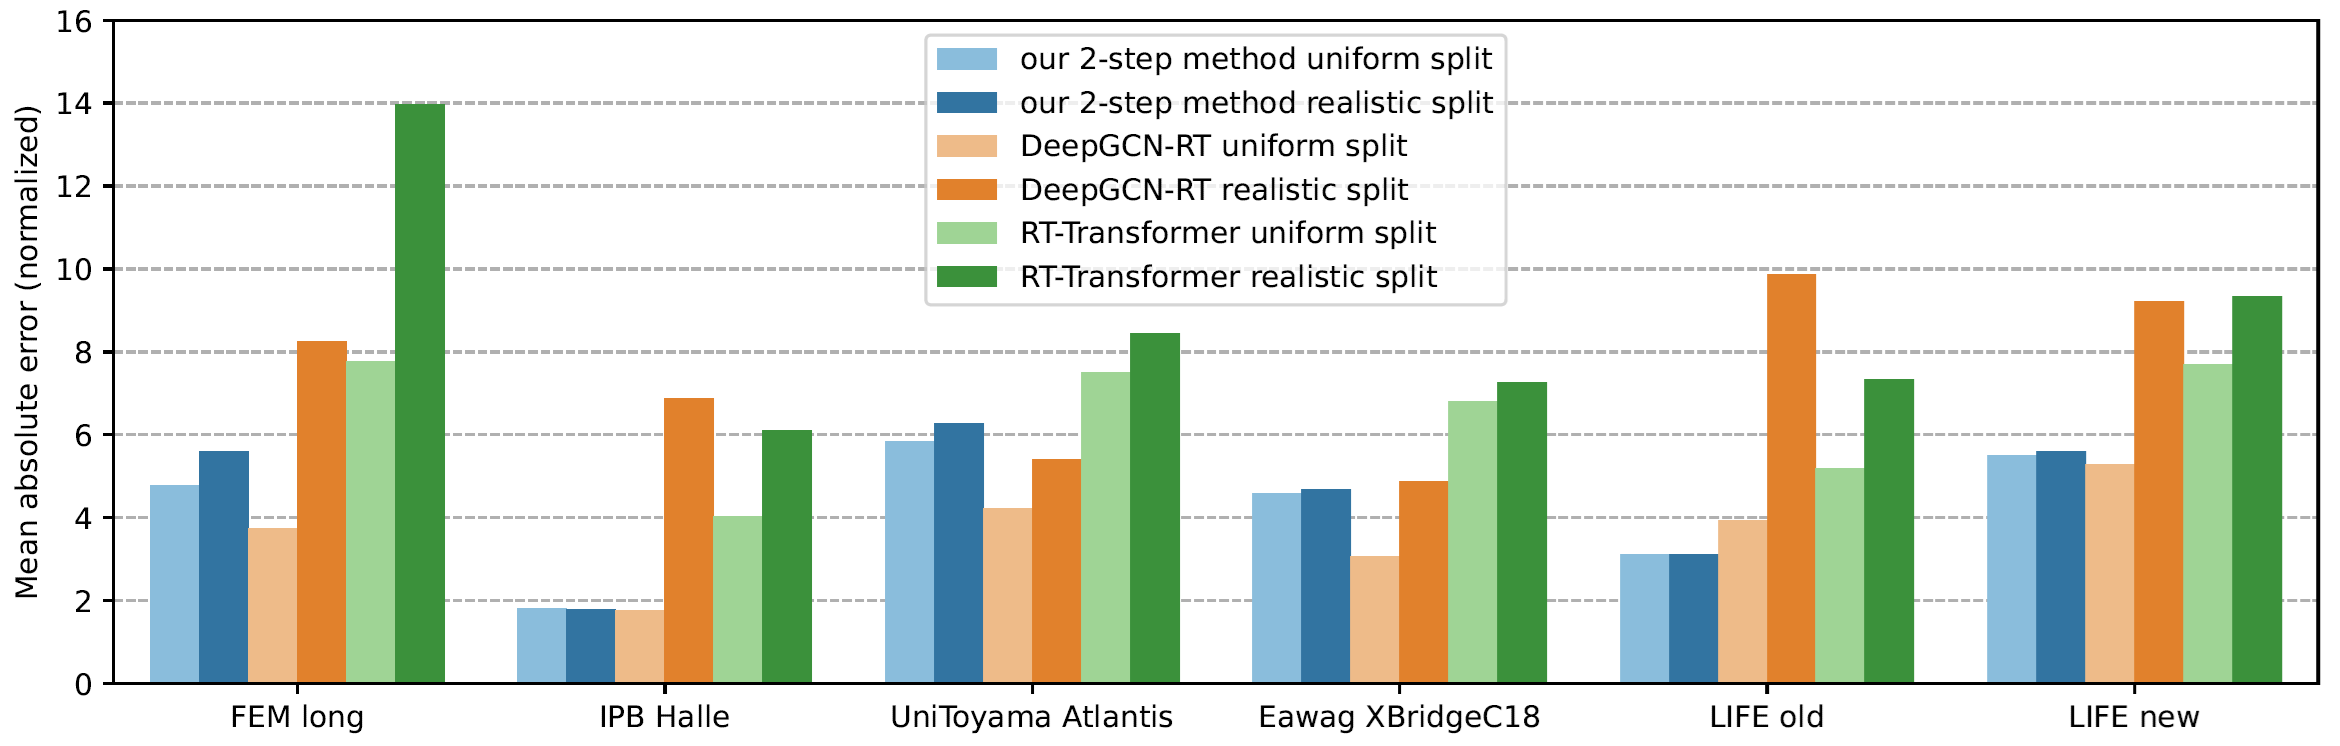
Now comes the cool part: Our method for retention time prediction already performs better than any other method for retention time prediction. The performance is almost as good as that of best-in-class methods if we do a random (uniform) split of the data on the target system. Yet, we all know (or, we all should know) that uniform splitting of small molecules is not a smart idea; it results in massively overestimating the power of machine learning models. Now, our model is not trained (fine-tuned) on data from the target system. Effect: Our method works basically equally well for any splitting of the target dataset. And, we already outperform the best-in-class method.
Why am I telling you that? I mean, besides showing off? (I sincerely hope that you share my somewhat twisted humor.) And, why did I say “already” above? Thing is, retention time prediction is dead, and you might not want to ruin your PhD student’s career by letting him/her try to develop yet another machine learning model for retention time prediction. But now, there is a new, much cooler task for you and/or your PhD student!
- If you are into graph machine learning, have a look at the problem of retention order index (ROI) prediction. This problem is both challenging and relevant, I can guarantee you that. Different from somewhat ill-posed problems of predicting complex biological traits such as toxicity, there is good reason to believe that ROI prediction can ultimately be “solved”, meaning that predictions become more accurate than experimental errors. On the other hand, ROI prediction is challenging, so complex & intricate models can demonstrate their power. Data are already available for thousands of compounds, trending upward. In conjunction with our 2-step approach, a better model for ROI prediction will automatically result in a better method for transferable retention time prediction. To give a ballpark estimate on the relevance: There are more than 2.1 million scientific studies that use liquid chromatography for the analysis of small molecules, and the chromatography market has an estimated yearly volume of 4 to 5 billion Euro. Your method may allow users to predict retention times for compounds that are illegal to have in the lab (be it tetrodoxin or cocaine), for all compounds in all spectral libraries and molecular structure databases combined, for compounds that do not even exist or which we presently do not know about.
- If you are doing LC experiments, you might want to upload your LC dataset with authentic standards to RepoRT. I would assume that our 2-step method (see below for details) will be integrated into many computational tools for compound annotation shortly; at least for one method I am sure. Alternatively, you might want to use 2-step to plan you next experiment, maximizing the separation of your compounds. Now, the 2-step method can truly do transferable prediction of retention times: It can do the predictions even for columns that are altogether missing from the training data. But things get easier and predictions get more accurate if there is a dataset in the training data with exactly your chromatographic setup. Let’s not make things overly complicated: A grandmaster in chess may be able to play ten games blindfolded and simultaneously, but s:he would not do so unless it is absolutely necessary. To this end, upload your reference datasets now, get better predictions in the very near future! It does not matter what compounds are in your dataset, as long as it contains a reasonable number (say, 100) of compounds. Everything helps; and in particular, it will help your own predictions for your chromatographic setup!
Now, how does the 2-step method work? The answer is: We do not try to predict retention times, because that is impossible. Instead, we train a machine learning model that predicts a retention order index. A retention order index (ROI) is simply a real-valued number, such as 0.123 or 99999. The model somehow integrates the chromatographic conditions, such as the used column and the mobile phase. Given two compounds A and B from some dataset (experiment) where A elutes before B, we ask the model to predict two number x (for compound A) and y (for compound B) such that x < y holds. If we have an arbitrary chromatographic setup, we use the predicted ROIs of compounds to decide in which order the compounds elute in the experiment. And that is already the end of the machine learning part. But I promised you transferable retention time, and now we are stuck with some lousy ROI? Thing is, we found that you can easily map ROIs to retention times. All you need is a low-degree polynomial, degree two was doing the trick for us. No fancy machine learning needed, good old curve fitting and median regression will do the trick. To establish the mapping, you need a few compounds where you know both the (predicted) ROI and the (measured) retention time. These may be authentic standards, such as the 19 NAPS molecules mentioned above. If you do not have standards, you can also use high-confidence spectral library hits. This can be an in-house library, but a public library such as MassBank will also work. Concentrate on the 30 best hits (cosine above 0.85, and 6+ matching peaks); even if half of these annotations are wrong, you may construct the mapping with almost no error. And voila, you can now predict retention times for all compounds, for exactly this chromatographic setup! Feed the compound into the ROI model, predict a ROI, map the ROI to a retention time, done. Read our preprint to learn all the details.
At this stage, you may want to stop reading, because the rest is gibberish; unimportant “historical” facts. But maybe, it is interesting; in fact, I found it somewhat funny. I mentioned above that I never wanted to work on retention time prediction. I would have loved if somebody else would have solved the problem, because I thought my group should stick with the computational analysis of mass spectrometry data from small molecules. (We are rather successful doing that.) But for a very long time, there was little progress. Yes, models got better using transfer learning (pretrain/fine-tune paradigm), DNNs and transformers; but that was neither particularly surprising nor particularly useful. Not surprising because it is an out-of-the-textbook application of transfer learning; not particularly useful because you still needed training data from the target system to make a single prediction. How should we ever integrate these models with CSI:FingerID?
In 2016, Eric Bach was doing his Master thesis and later, his PhD studies on the subject, under the supervision of Juho Rousu at Aalto University. At some stage, the three of us came up with the idea to consider retention order instead of retention times: Times were varying all over the place, but retention order seemed to be easier to handle. Initially, I thought that combinatorial optimization was the way to go, but I was wrong. Credit to whom credit is due: Juho had the great idea to predict retention oder instead of retention time. For that, Eric used a Ranking Support Vector Machine (RankSVM); this will be important later. This idea resulted in a paper at ECCB 2018 (machine learning and bioinformatics are all about conference publications) on how to predict retention order, and how doing so can (very slightly) improve small molecule annotation using MS/MS. (Eric and Juho wrote two more papers on the subject.)
The fact that Eric was using a RankSVM had an interesting consequence: The RankSVM is trained on pairs of compounds, but what it is actually predicting is a single real-valued number, for a given compound structure. For two compounds, we then compare the two predicted numbers; the smaller number tells you the compound that is eluting first. In fact, the machine learning field of learning-to-rank does basically the same, in order to decide which website best fits with your Google DuckDuckGo query. I must say that back then, I did not like this approach at all; it struck me as overly complicated. But after digesting it for some time, I had an idea: What if we do not use ROIs to decide which compounds elutes first? What if we instead map these ROIs to retention times, using non-linear regression? Unfortunately, I never got Eric interested to go into this direction. And I tried; yes I tried.
About seven years ago, Michael Witting and I rather reluctantly decided to jointly go after the problem. (I would not dare to go after a problem that requires massive chemical intuition without an expert; if you are a chemist, I hope you feel the same about applying machine learning.) We had my crazy idea of mapping ROIs to retention times, and a few backup plans in case this would fail. We had two unsuccessful attempts to secure funding from the Deutsche Forschungsgemeinschaft. My favorite sentence from the second round rejection is, “this project should have been supported in the previous round as the timing would have been better”; we all remember how the field of retention time prediction dramatically changed from 2018 to 2019…? But as they say, it is the timing, stupid! We finally secured funding in May 2019; and I could write, “and the rest is history”. But alas, no. Because the first thing we had to learn was that there was no (more precisely, not enough) training data. Jan Stanstrup had done a wonderful but painstaking job to manually collect datasets “from the literature” for his PredRet method. Yet, a lot of metadata were missing (these data are not required for PredRet, we must not complain) and we had to dig into the literature and data to close those gaps. Also, we clearly needed more data to train a machine learning model. With this, our hunt for more data began, which we partly scraped from publications, partly measured on our own; kudos go to Eva Harrieder! This took much, much longer than we would ever have expected, and resulted in the release of RepoRT in 2023. Well, after that, it is the usual. It works, it doesn’t work, maybe it works; next, it is all bad again; the other methods are so much better; the other methods have memory leakage; now, we have memory leakage; and finally, success. Phew… And here it is.
What about HILIC? I have no idea; but I can tell you that it is substantially more complicated. In fact, there currently is not even a description of columns comparable to HSM and Tanaka for RP. Maybe, somebody wants to get something started? Also, HILIC columns are much more diverse than RP columns, meaning that we need more training data (currently, we have less) and a better way to describe the column than for RP. But hey, start now so that it is ready in 10 years; worked for us!
References
- Kretschmer, F., Harrieder, E.-M., Witting, M., Böcker, S. Times are changing but order matters: Transferable prediction of small molecule liquid chromatography retention times. ChemRxiv, https://doi.org/10.26434/chemrxiv-2024-wd5j8-v3, 2024. Version 3 from August 2025.
- Bach, E., Szedmak, S., Brouard, C., Böcker, S. & Rousu, J. Liquid-Chromatography Retention Order Prediction for Metabolite Identification. Bioinformatics 34. Proc. of European Conference on Computational Biology (ECCB 2018), i875–i883 (2018). [DOI]
- Bach, E., Rogers, S., Williamson, J. & Rousu, J. Probabilistic framework for integration of mass spectrum and retention time information in small molecule identification. Bioinformatics 37, 1724–1731 (2021). [DOI]
- Bach, E., Schymanski, E. L. & Rousu, J. Joint structural annotation of small molecules using liquid chromatography retention order and tandem mass spectrometry data. Nat Mach Intel 4, 1224–1237 (2022). [DOI]
- Stanstrup, J., Neumann, S. & Vrhovšek, U. PredRet: prediction of retention time by direct mapping between multiple chromatographic systems. Anal Chem 87, 9421–9428 (2015). [DOI]
- Snyder, L. R., Dolan, J. W. & Carr, P. W. The hydrophobic-subtraction model of reversed-phase column selectivity. J Chromatogr A 1060, 77–116 (2004). [DOI]
- Kimata, K., Iwaguchi, K., Onishi, S., Jinno, K., Eksteen, R., Hosoya, K., Araki, M. & Tanaka, N. Chromatographic Characterization of Silica C18 Packing Materials. Correlation between a Preparation Method and Retention Behavior of Stationary Phase. J Chromatogr Sci 27, 721–728 (1989). [DOI]
One billion queries served
Now, that number deserves a celebration: Our web services have served a billion queries! In detail, the CSI:FingerID web service processed 759 million queries, the CANOPUS web service 228 million, and MSNovelist has 17 million queries. During the last 12 months, 3816 users have processed their data using our web services. Excellent!
Remember when Gangnam Style was the first video on YouTube to hit 1 billion views? That was a big thing in December 2012; we do not expect the same amount of media coverage for our first billion, though. 😉 Indeed, one billion is a big number, and it is really hard to grasp it: See this beautiful video by Tom Scott to “understand” the difference between a million and a billion.
Anyways, many thanks to the team (mainly Markus Fleischauer) who make this possible, and who ensure that everything is running so smoothly! It should not be a surprise that processing 1.18 million queries per day (on average!), is a highly non-trivial undertaking. Auto-scalable, self-healing compute infrastructure and highly optimized database infrastructure are key ingredients for keeping small molecule annotations flowing smoothly to our global community.
PS. The one billion also cover the queries processed by the Bright Giant and their servers, who are offering these services to companies. One counter to rule them all…
Sebastian will receive an ERC advanced grant
Excellent news: Sebastian will receive an ERC Advanced Grant from the European Research Council!
In the project BindingShadows, we will develop machine learning models that predict whether some query molecule has a particular bioactivity (say, toxicity) or is binding to a certain protein, where the only information we have about the query molecule is its tandem mass spectrum. The clue is: The model is supposed to do that when the identity and structure of the molecule is not known; not known to us, not known to the person that measured the data, not known to mankind (aka novel compounds).
Clearly, we will not do that for one bioactivity or one protein, but for all of them in parallel. Evolution has, through variation and selection, optimized the structure of small molecules for tasks such as communication and warfare, and the pool of natural products is enriched with bioactive compounds. Our project will try to harvest this information.
Sounds interesting? Looking for a job? Stay tuned, as we will shortly start searching for PhD and postdoc candidates!
Meet Markus and Jonas at the 4th International Summer School in Non-Targeted Metabolomics Data Mining
Markus and Jonas will contribute to the summer school with a workshop about SIRIUS. For all interested, it takes place 18. to 22. August 2025 in Copenhagen, Denmark. We hope to meet many of you there!
How many small molecules could be out there?
Every (put a large number here) days I stumble over the question, “how large is the universe of small molecules?” in a publication or a blog. Not the number of small molecules that we already “know” – those are covered in databases such as HMDB, PubChem or ZINC. (Although many compounds in PubChem etc. are purely hypothetical, too.) Not the number of metabolites that actually exist in nature. Also, we do not care if these small molecules are synthesizable with current technology. Rather, we want to know: How large is the space of small molecules that could exist? These could be natural small molecules (natural products, secondary metabolites) or synthetic compounds. I usually do not like the numbers that people report as “the truth”, as one estimate was taken out of context and started to develop a life of its own. Hence, I thought I write down what I know.
Obviously, we have to first define precisely what we actually counting. Since the problem is already hard enough, we usually do not care about 3d considerations (usually including stereochemistry), and simply ask for the number of molecular graphs (chemical 2d structures). On the one hand, resulting estimates are a lower bound, as adding stereochemistry into the mix results in more structures; on the other hand, resulting estimates are upper bounds, in the sense that many molecular graphs that we draw, cannot exist in 3d space. For the sake of simplicity, let’s forget about this problem.
Next, we have to define what a “small molecule” actually is. Usually, we simply apply a threshold on the mass of the molecule, such as “all molecules below 1000 Dalton“. If you prefer, you may instead think of “molecular weight”; this is the expected mass of the molecule, taken over all isotopologues and, hence, slightly larger. Yet, people usually consider mass in these considerations. Maybe, because mass spectrometry is one of the (maybe, the) most important experimental technology for the analysis of small molecules; maybe, because isotopes make a big difference for small molecules. Since our bounds on mass are somewhat arbitrary, anyways, this is not a big problem: Why exactly 1000 Dalton? Is prymnesin-B1 a small molecules? It is not a peptide, not a lipid, not a macromolecule, and it sure looks like a biological small molecule; it is just “too heavy” (1819.5 Dalton). For our calculations we will stick with the mass of 1000 Dalton; yet, it all still applies when you want to use a different threshold, and doing so is actually very simple, see below.
Now, the number of small molecules that people are reporting and repeating, making this number “more and more true” (to the point that Google Gemini will return that number as the correct answer when you query with Google) comes from a paper by Bohacek et al. (1997). The caption of Figure 6 contains the sentence “A subset of molecules containing up to 30 C, N, O, and S atoms may have more than 1060 members”. The authors make some back-of-the-envelope calculations in a long footnote, to further support this claim. The authors clearly state that the actual numbers they are giving are incorrect, for each step of their calculations. These calculations are merely meant to demonstrate that the true number is enormously huge; and, that the actual number is not that important, and might never be known to mankind. Unfortunately, many readers did not grasp the second part of what the authors were saying and instead, starting reporting the number “1060 small molecules” as if this number had been calculated for good. From there, it was only a small step into a Science/Nature news (I have to search for it), publications, websites, and finally, the “knowledge” of a large language model such as Gemini. The Wikipedia article about Chemical Space is much more cautious, and also mentions the 500 Dalton cutoff that Bohacek et al. assumed, as they were interested in pharmacologically active molecules. Funnily, Google Gemini does not link to the Wikipedia article, but rather to a “random” website that cites the number of Bohacek et al..
Let us see if we can do better than that. First, we look at a few things that are known. The On-Line Encyclopedia of Integer Sequences (OEIS) gives us loads of helpful numbers:
- Alkanes are hydrocarbons (carbohydrates with no oxygen) with the “minimal” molecular formula Cn H2n+2 and have no multiple bonds, a tree structure, and no cycles. The number of alkanes can be found in sequence A000628, see also here. Yet, this sequence counts each individual stereoisomer, different from what we said above. The sequence A000602 counts different stereoisomers as identical. For upper bound 1000 Dalton we use n = 71 (nominal mass 996 Dalton), and this is 1 281 151 315 764 638 215 613 845 510 structures, about 1.28 · 1027, or 1.28 octillion. Clearly, not all of them are possible; yet, the number of of “impossible” structures may be smaller than one may think. Alkanes are small molecules, so this is a lower bound on the number of small molecules of this mass.
- In fact, we can approximate – in the colloquial and in the mathematical sense – this number using the closed formula (i.e. the formula has no recurrences)
0.6563186958 · n-5/2 · 2.815460033n,
see Table 3 and equation (16) here (reprint here). For n = 71 this approximation is 1.279 · 1027, which is already pretty close to the true (exact) number. Importantly, this allows us to classify the growth as exponential, meaning that increasing n by one, we have to multiply the number of molecules by a constant (roughly 2.8). We can safely ignore the non-exponential part of the equation, as its influence will get smaller and smaller when n increases. Exponential growth might appear frightening, and in most application domains it would be our enemy; but for counting small molecules, it is actually our friend, as we will see next. - Molecules are no trees, they have cycles. So, another idea to get an idea on the number of small molecules is to count simple, connected graphs. “Simple” means that we do not allow multiple edges between two nodes (vertices). We have different types of bounds (single, double, etc.) but multi-edges means that there can be 1000 edges between two nodes, and that is definitely not what we want. We also ignore that we have different elements, that is, labeled nodes. This number is found in sequence A001349. This number growths super-exponential, meaning that it growths faster (for n to infinity) than any exponential function. That is fast, and we indeed observe that already for reasonable number of nodes, numbers become huge: For n = 19 nodes it is 645 465 483 198 722 799 426 731 128 794 502 283 004 (6.45 · 1038) simple graphs; for n = 49 we already have 1.69 · 10291 simple graphs. That is a lot, compare to the number of alkanes. Even more intimidating is the growth: Going from n = 49 to n = 50 nodes we reach 1.89 x 10304 simple graphs, a factor of 11 258 999 068 424 (11 trillion) for a single node added. Suddenly, factor 2.8 does not look that bad any more, does it?
- Now, one can easily argue that simple graphs are too general: The number of edges incident to (touching) a node is not restricted, whereas it is clearly restricted for molecular graphs. For simplicity, let us consider Carbon-only molecules; carbon has valence 4. Let us further simplify things by only considering cases where each node is connected to exactly 4 other nodes (chemically speaking, no hydrogen atoms, no double bonds). The number of 4-regular, simple, connected graphs is sequence A006820. Given that there is a single such graph for n = 6, it might be surprising how quickly numbers are increasing even for moderate number of nodes n: For n = 28 there are 567 437 240 683 788 292 989 (5.67 · 1020) such graphs.
All of these numbers give us a first impression of the number of small molecules we could consider. Yet, none of them give us any precise number to work with: The number of alkanes is just a lower bound, the number of simple graphs is too large, and the number of 4-regular simple graphs is simultaneously too large (we cannot simply demand that two Carbon atoms are connected, we somehow have to realize that in 3d) and too small (4-regular, Carbon-only). That is not very satisfactory. Yet, we can already learn a few important things:
- The coefficient c before the 10k is actually not very important. If we are dealing with numbers as large as 10100, then a mere factor of below ten does not make a substantial difference. It is the exponent that is relevant. Similarly, it does not make a relevant change if we think about mass or nominal mass.
- If we have exponential growth, as we did for alkanes, then it is straightforward to calculate your own estimate in case you are unhappy with the upper bound on mass of 1000 Dalton. Say, you prefer 500 Dalton; then, the estimate for the number of alkanes goes from 1027 to 1027/2 = 3.16 · 1013. Similarly, for 1500 Dalton, we reach 1027·1.5 = 3.16 · 1040 alkanes.
Yet, we can also look at the problem empirically: There exist different methods (the commercial MOLGEN, OMG, MAYGEN, and currently the fastest-tool-in-town, Surge) to generate molecular structures for a given molecular formula. For example, Ruddigkeit et al. generated “all” small molecule structures with up to 17 heavy atoms (CNOS and halogens). I put the “all” in apostrophes because the authors used highly aggressive filters (ad hoc rules on, does a molecule make sense chemically? etc.) to keep the numbers small. With that, they generated the GDB-17 database containing 166 443 860 262 (1.66 · 1011) molecular structures. Unfortunately, only about 0.06% of that databases are publicly available. Also, the aggressive filtering is diametral to our question, how many molecular structures exit.
More interesting for us is a paper from 2005: That year, Kerber et al. published the paper “Molecules in silico: potential versus known organic compounds“. For the paper, the authors generated all small molecule structures with nominal mass up to 150 Dalton, over the set of elements CHNO, using MOLGEN. For example, MOLGEN constructs 615 977 591 molecular structures for mass 150 Dalton. This paper also contains the highly informative Figure 1, where the authors plot the number of (theoretical) molecular structure against nominal mass m. Looking at the plot, I could not resist to see exponential growth, which (if you use a logarithmic y-axis) comes out as a simple line. Remember that exponential growth is our friend.
So, let’s do that formally: I fitted a regression line to the empirical numbers (see Chapter 10 here), and what comes out of it is that we can approximate the number of small molecules between 80 and 150 Dalton as 2.0668257909 · 10−4 · 1.2106212044m. Be warned that there is not the slightest guarantee that growth will continue like that for masses larger than 150 Dalton; it is highly unlikely that growth might slow down, but given that the number of simple graphs is growing superexponentially, maybe the same is true here? I cannot tell you, I am not that much into counting and enumerating graphs. But in any case, my Milchmädchenrechnung should make a much better estimate than anything we have done so far; to be precise, much better than anything else I have ever heard of. For nominal mass 1000 Dalton this number is 2.11 · 1079 molecular structures.
But wait! The above formula tells us the (very approximate) number of all small molecules with mass exactly 1000 Dalton; what we want to know is the number of molecules with mass up to 1000 Dalton. Fun fact about exponential growth: These numbers are basically the same, with a small factor. Recall that the number of molecules with mass m equals a · xm. Pretty much every math student has to prove, during his first year, the equation
To this end, if we want to know the number of molecules with mass up to 1000 Dalton, we simply use the number of molecules with mass exactly 1000 Dalton, and apply a small correction. In detail, the number of molecules with mass up to 1000 Dalton is (almost exactly) 1.21062 / (1.21062 – 1) = 5.74786 times the number of molecules with mass exactly 1000 Dalton. We reach an estimate of 1.21 · 1080 small molecules over elements CHNO with mass up to 1000 Dalton. For mass up to 500 Dalton it is about 1040 molecules (which tells us that the inital estimate was rather far off, and I do not expect that even a superexponential growth could correct that); for mass up to 1500 Dalton it is 10120 small molecules.
But, alas, this estimate is for elements CHNO only; what if we add more elements to the mix? For halogens it is mainly fluorine that will substantially increase the number of molecular structures: Halogens are much heavier than hydrogen. If we replace a single H by F in a molecular structure, then the nominal mass of the molecule increases by 8. The above estimate tells us that there are only 1/4.61 = 0.216 times the molecular structures to consider if we decrease the mass by 8. On the “plus side” we can replace any H by F to reach a different molecule, if we gallantly ignore the problem of isomorphic graph structures. For more than one fluorine, the combinatorics of where we can add them growths polynomially; but at the same time, the number of structures we start from decreases exponentially. Hence, one should not expect a substantially higher number if we add fluorine to the mix; and an even smaller effect for the other halogens. More worrying, from a combinatorial standpoint, are the elements sulfur and phosporus. In particular sulfur with valence 6 could wreak havoc of our estimates. I don’t know what happens if you allow an arbitrary number of S and P; I also don’t know if we would even want such all-sulfur molecules. The only number that I can report is again from the Kerber et al. paper: They also generated all molecular structures for nominal mass 150 Dalton and elements CHNOSiPSFClBrI, using the (unrealistic) fixed valences 3 for phosphorus and 2 for sulfur, resulting in 1 052 647 246 structures, compared to 615 977 591 molecular structures over elements CHNO. Yet, this small increase in structures (merely doubled, phew) should not lull us into a false sense of security: Not only the unrealistic valences, even more so the relatively small mass could mean that in truth, the number of structures with sulfur and phosphorus is substantially higher. I suggest we stick with the number 1080 and in the back of our minds, keep the note “it is likely even worse”.
It is not easy to grasp a number as large as 1080, so a few words to get a feeling:
- The number 1080 is 100 septemvigintillion, or 100 million billion billion billion billion billion billion billion billions. If we have a name for it, it cannot be that bad.
- The observable universe contains an estimated 1080 atoms. If we had the technology to build a computer that uses every single atom of the observable universe as its memory, and where we need only a single atom to store the complete structure of a small molecule, then the observable universe would be “just right” to store all small molecules up to 1000 Dalton.
- Using the same technology, molecules up to 1010 Dalton would be absolutely impossible to store, and 1100 Dalton would be absurd. For molecules up to 2000 Dalton you would need 1080 observable universes. Alternatively, a technology that puts a complete universe into a single atom, and does so for each and every atom of this universe. See the final scene of Men in Black.
- For comparison, the total amount of storage on planet Earth is, at the moment, something like 200 zettabytes, mostly on magnetic tapes. If we could store every molecular structure in 2 bytes, this would allow us to store 1023 molecular structures. If we could now again fold all the storage into a single byte, and again, and again, we reach – after four iterations of folding – the required memory.
- If we have a computer enumerating molecular structures at a rate of 1 billion structures per second, then we could enumerate 3.15 · 1016 structures per year, and it would take 3.17 · 1063 years to enumerate them all. For comparison, the estimated age of the universe is 1.38 · 1010 years. We would need more than 1050 universes to finish our calculations, where in each universe we have to start our computations with the big bang.
- Maybe, it helps if we use all computers that exist on planet Earth? Not really; there are maybe 10 billion computers (including smartphones) on Earth, but let’s make it 1000 billion, to be on the safe side. The required time to enumerate all structures drops to 3.17 · 1051 years.
- But maybe, we can use a quantum computer? Grover’s algorithm brings down the running times to
 if we have to consider n objects. Again assuming that our quantum computer could do 1 billion such computations per second, we would end up with a running time of 1031 seconds, or 3.17 · 1023 years. That is still a looong time. There might be smarter ways of processing all structures on a quantum computer than using Grover’s algorithm; but so far, few such algorithms for even fewer problems have been found.
 if we have to consider n objects. Again assuming that our quantum computer could do 1 billion such computations per second, we would end up with a running time of 1031 seconds, or 3.17 · 1023 years. That is still a looong time. There might be smarter ways of processing all structures on a quantum computer than using Grover’s algorithm; but so far, few such algorithms for even fewer problems have been found.
Now, 1080 is a large number, and you might thing, “this is the reason why dealing with small molecules is so complicated!” But that is a misconception. It is trivial to find much larger numbers that a computer scientist has to deal with every day; just a few examples from bioinformatics: The number of protein sequences of length 100 is 1.26 · 10130. Yet, we can easily work with longer protein sequences. The number of pairwise alignments for two sequences of length 1000 is 2.07 · 10600. Yet, every bioinformatics student learns during his/her first year how to find the optimal alignment between two sequences, sequences that may be much longer than 1000 bases. The thing is, sequences/strings are simple structures, and we have learned to look only for the interesting, i.e. optimal alignments. (Discrete optimization is great!) What makes dealing with small molecule structures complicated is that these structures are themselves rather complicated (graphs, when even trees can be a horror, ask someone from phylogenetics) plus at the same time, there are so many, which prevents us from simply enumerating them all, then doing the complicated stuff for every structure.
That’s all, folks! Hope it helps.
Yet another blog
Hi all, I thought I put my blog post (singular) into its own category. Not sure about the title, that may change. Why another blog when there is already this great blog on metabolomics and mass spectrometry? Because here I may talk about computational stuff as well, such as failed evaluations of machine learning methods (that one never gets old). I hope to write something once every four fortnights, let’s see how that works out. :shrug:
Algorithmische Phylogenetik statt Sequenzanalyse im SoSe 2025
Im kommenden Semester wird statt Sequenzanalyse das Modul Algorithmische Phylogenetik angeboten. Sequenzanalyse wird dann wieder im SoSe 2026 zu hören sein.
SIRIUS 6.1.0 is Here!
We’re excited to announce the latest version of SIRIUS designed to improve your small molecule analysis workflow with a refreshed interface, streamlined processes, and several important fixes that ensure smoother performance and better data handling.
Highlights:
? New Color Scheme: A consistent and intuitive look throughout the entire identification process.
⚡ Streamlined Workflows: Tools are now automatically activated/deactivated to comply with SIRIUS workflow principles. You can also easily save and reload computation settings with our new preset function.
? Welcome Page Redesign: Get a quick overview of your account, connection details, and helpful resources to make the most of SIRIUS.
? Improved Result Views: Numerous enhancements and fixes across result views for a smoother analysis experience.
Times are changing but order matters
Our preprint Times are changing but order matters: Transferable prediction of small molecule liquid chromatography retention times is finally available on chemRxiv! Congratulations to Fleming and all authors.
In short, we show that prediction of retention times is a somewhat ill-posed problem, as retention times vary substantially even for nominally identical condition. Next, we show that retention order is much better preserved; but even retention order changes when the chromatographic conditions (column, mobile phase, temperature) vary. Third, we show that we can predict a retention order index (ROI) based on the compound structure and the chromatographic conditions. And finally, we show that one can easily map ROIs to retention times, even for target datasets that the machine learning model has never seen during training. Even for chromatographic conditions (column, pH) that are not present in the training data. Even for “novel compounds” that were not in the training data. Even if all of those restrictions hit us simultaneously.
In principle, this means that transferable retention time prediction (for novel compounds and novel chromatographic conditions) is “solved” for reversed-phase chromatography. There definitely is room for improvement, but that mainly requires more training data, not better methods. For that, we need your help: We need you, the experimentalists, to provide your reference LC-MS datasets. It does not matter what compounds are in there, it does not matter what chromatographic setup you used; as long as it is references data measured from standards (meaning that you know exactly each compound in the dataset), and as long as you tell us the minimum metadata, this will improve prediction quality.
You can post your data wherever you like, but you can also upload them to RepoRT so that in the future, scientists from machine learning can easily access them. We now provide a web app that makes uploading really simple. If you are truly interested in retention time prediction, then this should be well-invested 30 min.
Meet Jonas at the IMPRS course on mass spectrometry in the MPI for Chemical Ecology
Jonas will give a lecture on SIRIUS at the IMPRS course “Introduction to mass spectrometry techniques and analysis” (2-4 December) in the Max Planck Institute for Chemical Ecology.
Meet us at GCB 2024 in Bielefeld
At GCB 2024 (30th Sep. – 2nd Oct.), Fleming will give a presentation about RepoRT. Jonas, Leopold and Roberto will show their posters in the poster session.