Visualizing the universe of small biomolecules

Have you ever wanted to look at the universe of biomolecules (small molecules of biological interest, including metabolites and toxins)? Have you ever wondered how your own dataset fits into this universe? In our preprint, we introduce a method to do just that, using MCES distances to create a UMAP visualization. Onto this visualization, any compound-dataset can be projected, see the interactive example below. In case it is slow, download the code here. Move your mouse over any dot to see the underlying molecular structure.

If you are wondering, “where did the lipids go?”, check this out. See the preprint on why we excluded them above. Looking at commonly used datasets for small molecule machine learning, big differences can be seen in the coverage of the biomolecule space. For example, the toxicity datasets Tox21 and ToxCast appear to rather uniformly cover the universe of biomolecules. In contrast, SMRT is a massive retention time dataset, but appears to be concentrated on a specific area of the compound space. The thing is: One must not expect a machine learning model trained on only a small part of the “universe of biomolecules”, to be applicable to the whole universe. This is a little too much to be asked. Hence, visualizing your data in this way may give you a better understanding of what your machine learning model is actually doing, where it will thrive and where it might fail.

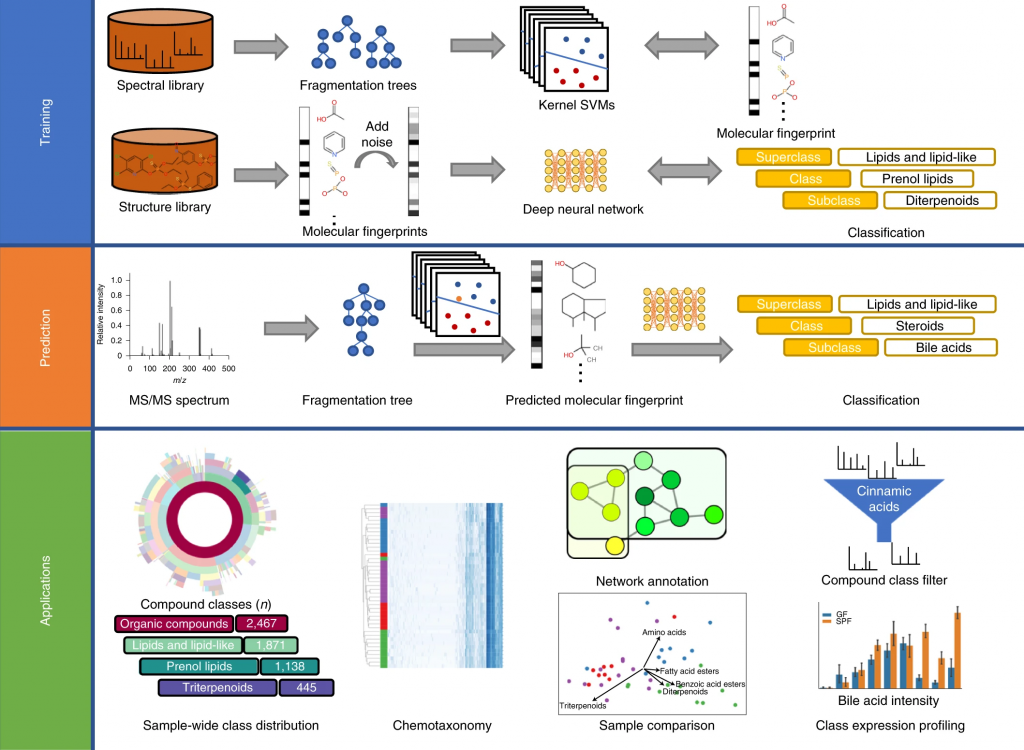
To compare molecular structures, we compute the MCES (Maximum Common Edge Subgraph) of the two molecular structures. Doing so is not new, but comes at the prize that computing a single distance is already an NP-hard problem, see below. Then, why on Earth are we not using Tanimoto coefficients computed from molecular fingerprints, just like everybody else does? Tanimoto coefficients and related fingerprint-based similarity and dissimilarity measures have a massive advantage over all other means of comparing molecular structures: As soon as you have computed the fingerprints of all molecular structures, computing Tanimoto coefficients is blindingly fast. Hence, if you are querying a database, molecular fingerprints are likely the method of choice. We ourselves have been and are heavily relying on molecular fingerprints: CSI:FingerID is predicting molecular fingerprints from MS/MS data, CANOPUS is predicting compound classes from molecular fingerprints, and COSMIC is using Tanimoto coefficients because they are, well, fast. Yet, if you have ever worked with molecular fingerprints and, in particular, Tanimoto coefficients yourself, you must have also noticed their peculiarities, quirks and shortcomings. In fact, from the moment people used Tanimoto coefficients, others have warned about these unexpected and highly undesirable behaviors; an early example is by Flower (1998). On the one hand, a Tanimoto coefficient of below 0.7 can be the result of two compounds with only one hydroxy group added. On the other hand, two highly different compounds, one half the size of the other, may also have a Tanimoto coefficient of 0.7. Look at the two examples below: According to the Tanimoto coefficient, the two structures on the left are less similar than the two on the right. Does that sound right? By the way: The same holds true for any fingerprint-based similarity or dissimilarity measure, and also for any other fingerprint type. These are examples but the problem is universal.

In contrast, the MCES distance is much more intuitive to interpret, as it is the edit distance between molecule graphs and, hence, nicely represents our intuition of chemical reactions. For example, adding an hydroxy group results in an MCES distance of one. Don’t get us wrong: The MCES distance is not perfect, either. First and foremost, the MCES problem is NP-hard; hence, computing a single exact distance between two molecules might take days or weeks. We can happily report that we have “solved” this issue by introducing the myopic MCES distance: We first quickly compute a lower bound on the true distance. If this bound tells us that the true distance is larger than 22, then we would argue that knowing the exact value (maybe 22, maybe 25, maybe 32) is of little help: These two molecules are very, very different, full stop. But if we find that the lower bound only guarantees that the distance is small (say, at most 20) then we use exact computations based on solving an Integer Linear Program. With some more algorithm engineering, we were able to bring down computation time to fractions of a second. And that means that we were able to compute all distances for a set of 20k biomolecular structures, plus several well-known machine learning datasets, in reasonable time and on our limited compute resources. (Sadly, we still do not own a supercomputer.) You will not be able to do all-against-all with a million molecular structures, so if your research requires to do so, you might have to stick with the Tanimoto coefficient, quirky as it is. Yet, we found that subsampling does indeed give us rather reproducible results, see Fig. 7 of the preprint (page 23).

There are other shortcomings of the MCES distance: For example, it is not well-suited to capture the fact that one molecular structure is a substructure of the other. This is unquestioned, but what is also true, is: The MCES distance does not have peculiarities or quirks. The fact that it does not capture substructures, can be readily derived from its definition; this behavior is by design. In case you do not like the absolute MCES distance, because you think that large molecules are treated unfairly, then feel free to normalize it using the size of the molecules. Now that we can (relatively) swiftly compute the myopic MCES distance, we can play around with it.

We used UMAP (Uniform manifold approximation and projection) to visualize the universe of biomolecules but, honestly, we don’t care. You prefer t-SNE? Use that! You prefer a tree-based visualization? Use that! See the following comparison (from left to right UMAP, t-SNE and a Minimum Spanning Tree), created in just a few minutes. Or, maybe Topological Data Analysis? Fine, too! All those visualizations have their pros and cons, and one should always keep Pachter’s elephant in the back of one’s brain. But the thing is: We know that the space of molecular structures has an intrinsic structure, and we are merely using the different visualization methods to get a feeling for its intrinsic structure.

Now, one peculiarity of the above UMAP plots must be mentioned here: When comparing different ML training datasets, we re-used the UMAP embedding computed from the biomolecular structures alone (Fig. 3 in the preprint). Yet, UMAP will neatly integrate any new structures into the existing “compound universe” even if those new structures are very, very different from the ones that were used to compute the projection. This is by design of UMAP, it interpolates, all good. So, we were left with two options: Recompute the embedding for every subplot? This would allow us to spot if a dataset contains compounds very different from all biomolecular structures, but would result in a “big mess” and an uneven presentation. Or, should we keep the embedding fixed? This makes a nicer plot but hides “alien compounds”. We went with the second option solely because the overall plot “looks nicer”; in practice, we strongly suggest to also compute a new UMAP embedding.

In the preprint, we discuss two more ways to check whether a training dataset provides uniform coverage of the biological compound space: We examine the compound class distribution, to check whether certain compound classes are “missing” in our training dataset. And finally, we use the Natural Product-likeness score distribution to check for lopsidedness. All of that can give you ideas about the data you are working with. There have been numerous scandals about machine learning models repeating prejudice in the training data; don’t let the distribution of molecules in your training data let you draw conclusions which, at closer inspection, might be lopsided or even wrong.

If you want to compute myopic MCES distances yourself, find the source code here. You will need a cluster node, or proper patience if you do computations on your laptop. All precomputed myopic MCES distances from the preprint can be found here. We may also be able to help you with further computations.

Retention time repository preprint out now

The RepoRT (well, Repository for Retention Times, you guessed it) preprint is available now. It has been a massive undertaking to get to this point; honestly, we did not expect it to be this much work. It is about diverse reference compounds measured on different columns with different parameters and in different labs. At present, RepoRT contains 373 datasets, 8809 unique compounds, and 88,325 retention time entries measured on 49 different chromatographic columns using varying eluents, flow rates, and temperatures. Access RepoRT here.

If you have measured a dataset with retention times of reference compounds (that is, you know all the compounds identities) then please, contribute! You can either upload it to GitHub yourself, or you can contact us in case you need help. In the near future, a web interface will become available that will make uploading data easier. There are a lot of data in RepoRT already, but don’t let that fool you; to reach a transferable prediction of retention time and order (see below), this can only be the start.

If you want to do anything with the data, be our guests! It is available under the Creative Commons License CC-BY-SA.

If you want to use RepoRT for machine learning and retention time or order prediction, then, perfect! That is what we intended it for. 🙂 We have done our best to curate RepoRT: We have searched and appended missing data and metadata; we have standardized data formats; we provide metadata in a form that is accessible to machine learning; etc. For example, we provide real-valued parameters (Tanaka, HSM) to describe the different column models, in a way that allows machine learning to transfer between different columns. Yet, be careful, as not all data are available for all compounds or datasets. For example, it is not possible to provide Tanaka parameters for all columns; please see the preprint on how you can work your way around this issue. Similarly, not all compounds that should have an isomeric SMILES, do have an isomeric SMILES; see again the preprint. If you observe any issues, please let us know.

UMAP plot RP vs HILIC


Back from ASMS 2023

Markus, Martin and Marcus have been at ASMS 2023 in Houston, USA.

Thanks everyone for the great discussions at our poster.

Most wanted: Tanaka and HSM parameters for RP columns

A few years ago, Michael Witting and I joined forces to get a transferable prediction of retention times going: That is, we want to predict retention times (more precisely, retention order) for a column even if we have no training data for that column. Yet, to describe a column to a machine learning model, you have to provide some numerical values that allow the model to learn what columns are similar, and how similar. We are currently focusing on reversed-phase (RP) columns because there are more datasets available, and also because it appears to be much easier to predict retention times for RP.

Tanaka parameters and Hydrophobic Subtraction Model (HSM) parameters are reasonable choices for describing a column. Unfortunately, for many columns that are in “heavy use” by the metabolomics and lipidomics community, we do not know these parameters! Michael recently tweeted about this problem, and we got some helpful literature references — kudos! for that. Yet, there are still many columns in the unknown.

Now, the problem is not so much that the machine learning community will not be able to make use of training data from these columns, simply because a few column parameters are unknown. This is unfortunate, but so be it. The much bigger problem is that even if someone comes up with a fantastic machine learning model for transferable retention time prediction — it may not be applicable for your column. Because for your column we do not know the parameters! That would be very sad.

So, here is a list of columns that are heavily used, but where we do not know Tanaka parameters, HSM parameters, or both. Columns are ordered by “importance to the community”, whatever that means… If you happen to know parameters for any of the columns below, please let us know! You can post a comment below or write us an email or send a carrier pigeon, whatever you prefer. Edit: I have switched off comments, it was all spam.

Missing HSM parameters

  1. Waters ACQUITY UPLC HSS T3
  2. Waters ACQUITY UPLC HSS C18
  3. Restek Raptor Biphenyl
  4. Waters CORTECS UPLC C18
  5. Phenomenex Kinetex PS C18

Missing Tanaka parameters

  1. Waters CORTECS T3
  2. Waters ACQUITY UPLC HSS T3
  3. Waters ACQUITY UPLC HSS C18
  4. Restek Raptor Biphenyl
  5. Waters CORTECS UPLC C18
  6. Phenomenex Kinetex PS C18

MZmine 3 has appeared in Nature Biotechnology

Congratulations to Robin Schmid, Steffen Heuckeroth and Ansgar Korf: The article “Integrative analysis of multimodal mass spectrometry data in MZmine 3” has appeared in Nature Biotechnology, and we are very happy to be part of this research.

I don’t assume I have to explain what MZmine is. If you are doing small molecule LC-MS/MS, you are using MZmine, for one thing or the other.

In case you do not have access to Nature Biotechnology, here is a read-only version of the article.

Full citation: Schmid, R., Heuckeroth, S., Korf, A. et al. Integrative analysis of multimodal mass spectrometry data in MZmine 3. Nat Biotechnol (2023). https://doi.org/10.1038/s41587-023-01690-2

Project Harvester about to start

The Deutsche Forschungsgemeinschaft has provided us with funding for our project Harvester. The problem in many areas of small molecule machine learning is the available training data and how slowly more data become available. This is also true for MS/MS data, where doubling time is a decade or two, possibly more. To this end, a somewhat obvious idea is to resort to unlabeled data, as there is tons of it available (particularly in GNPS). Yet, using these data is non-trivial. We have already experimented with pre-training, but this improved annotation rates by a mere single percentage point. In our new project, we instead want to resort to self-training, a technique recently “rediscovered” and successfully used for AlphaFold2, among others. What we now need is someone to do the work and take the money. If you are interested, let us know!

MAD HATTER correctly annotates 98% of small molecule MS/MS searching in PubChem

We are thrilled to announce that our newest tool MAD HATTER can correctly annotate 98% of small molecule tandem mass spectra, when searching in PubChem! We are extremely excited about this massive breakthrough! MAD HATTER combines CSI:FingerID results with information from the searched structure database via a metascore, using viable compound information such as the melting point, or the number of “was it a cat I saw?” in the compound description.

Our evaluations use the well-known CASMI 2016 data, and we are happy to announce that MAD HATTER strongly outperforms all tools that participated in the contest. MAD HATTER also performs very well if we replace the MS/MS spectra by either empty spectra or random spectra. This opens up fantastic new venues in the future, where instrument vendors may replace bulky and expensive traps and collision cells by a random number generators or /dev/null.

Read the exciting preprint on bioRxiv: https://doi.org/10.1101/2022.12.07.519436

We assume that everybody will be thrilled to use MAD HATTER in the future. At the moment, you may find additional information here, here and here.

Update: Read the exciting final paper in Metabolites: https://doi.org/10.3390/metabo13030314

PhD position for EU HUMAN doctoral network

As part of the EU HUMAN doctoral network, my group is looking for a PhD student from bioinformatics, computer science or cheminformatics for the computational analysis of mass spectrometry data. The PhD student is expected to have experience with and interest in the development and evaluation of computational methods and machine learning models. The project will involve international and intersectorial secondments/visits to other project partners in the network for the doctoral candidates to learn new skills and foster collaborations.

The doctoral network HUMAN (Harmonising and Unifying Blood Metabolomic Analysis Networks) is a multidisciplinary consortium that focuses on topics such as cross-laboratory comparisons, integration, co-evaluation, and proofing of liquid chromatography mass spectrometry for the analysis of human blood. It offers twelve PhD positions.

If you are interested, check here for more details, contact Sebastian or apply here.


SIRIUS 4 End Of Life

After more than 4 successful years and over 300 million queries to our web services, SIRIUS 4 will reach its end of life on 31th of December 2022.

What does this mean for you? We will shut down the web services behind SIRIUS 4, so fingerprint prediction, structure database search and compound class prediction will not be possible with SIRIUS 4 anymore. Switching to SIRIUS 5 will solve the problem for you. As always, if you have a running long term project that exceeds the end of life date and cannot switch to SIRIUS 5 please contact us.  

We are part of the EU HUMAN doctoral network

We are happy to announce that we are part of the EU HUMAN doctoral network, funded by EU Horizon. The topic of the network is “Harmonising and Unifying Blood Metabolomic Analysis Networks“. In the very near future, we will officially advertise the doctoral positions that are part of this network on our website. My group is looking for a PhD student from bioinformatics, computer science or cheminformatics for the computational analysis of mass spectrometry data. The student is expected to have experience with and interest in the development and evaluation of computational methods and machine learning models. If you are interested, please contact Sebastian.

HUMAN is a multidisciplinary consortium that focuses on topics such as cross-laboratory comparisons, integration, co-evaluation, and proofing of liquid chromatography mass spectrometry for the analysis of human blood.


MSNovelist has appeared in Nature Methods

Congratulations to Michael “Michele” Stravs from the group of Nicola Zamboni at ETH Zürich: The article “MSNovelist: De novo structure generation from mass spectra” has appeared in Nature Methods, and we are thrilled to be part of this research.

MSNovelist workflow
MSNovelist transforms a MS/MS into a molecular fingerprint via the CSI:FingerID fingerprint prediction, then uses this fingerprint to generate molecular structures. Fig. by Michele Stravs, adapted from the MSNovelist Nature Methods paper.

In short, MSNovelist is a computational method that transforms the tandem mass spectrum of a small molecule into its molecular structure. Full stop. That sounds shocking and surprising, and in fact, I view this as the “final frontier” in small molecule mass spectrometry. It is understood that “certain restrictions apply”, as they say. But Michele has undertaken an huge amount amount of work to clearly show what the method can do and what it cannot; for example, an in-depth evaluation against a method that basically ignores MS/MS data when generating structures. That methods works disturbingly well; but if you think about it for some time, it becomes clear why: I just say, “blockbuster metabolites“. Michele has written a very nice blog post where he explains in much detail what MSNovelist is all about. If I had to recap the method in one sentence, then this is it: MSNovelist gives you a head start for the de novo elucidation of a novel structure.

We will make MSNovelist available through SIRIUS in an upcoming release — hopefully, soon.

ps. Also read the article “Some assembly required” by Corey D. Broeckling.

Full citation: M. A. Stravs, K. Dührkop, S. Böcker, and Nicola Zamboni. MSNovelist: De novo structure generation from mass spectra. Nature Methods, 2022. https://doi.org/10.1038/s41592-022-01486-3

SIRIUS 5 is released!

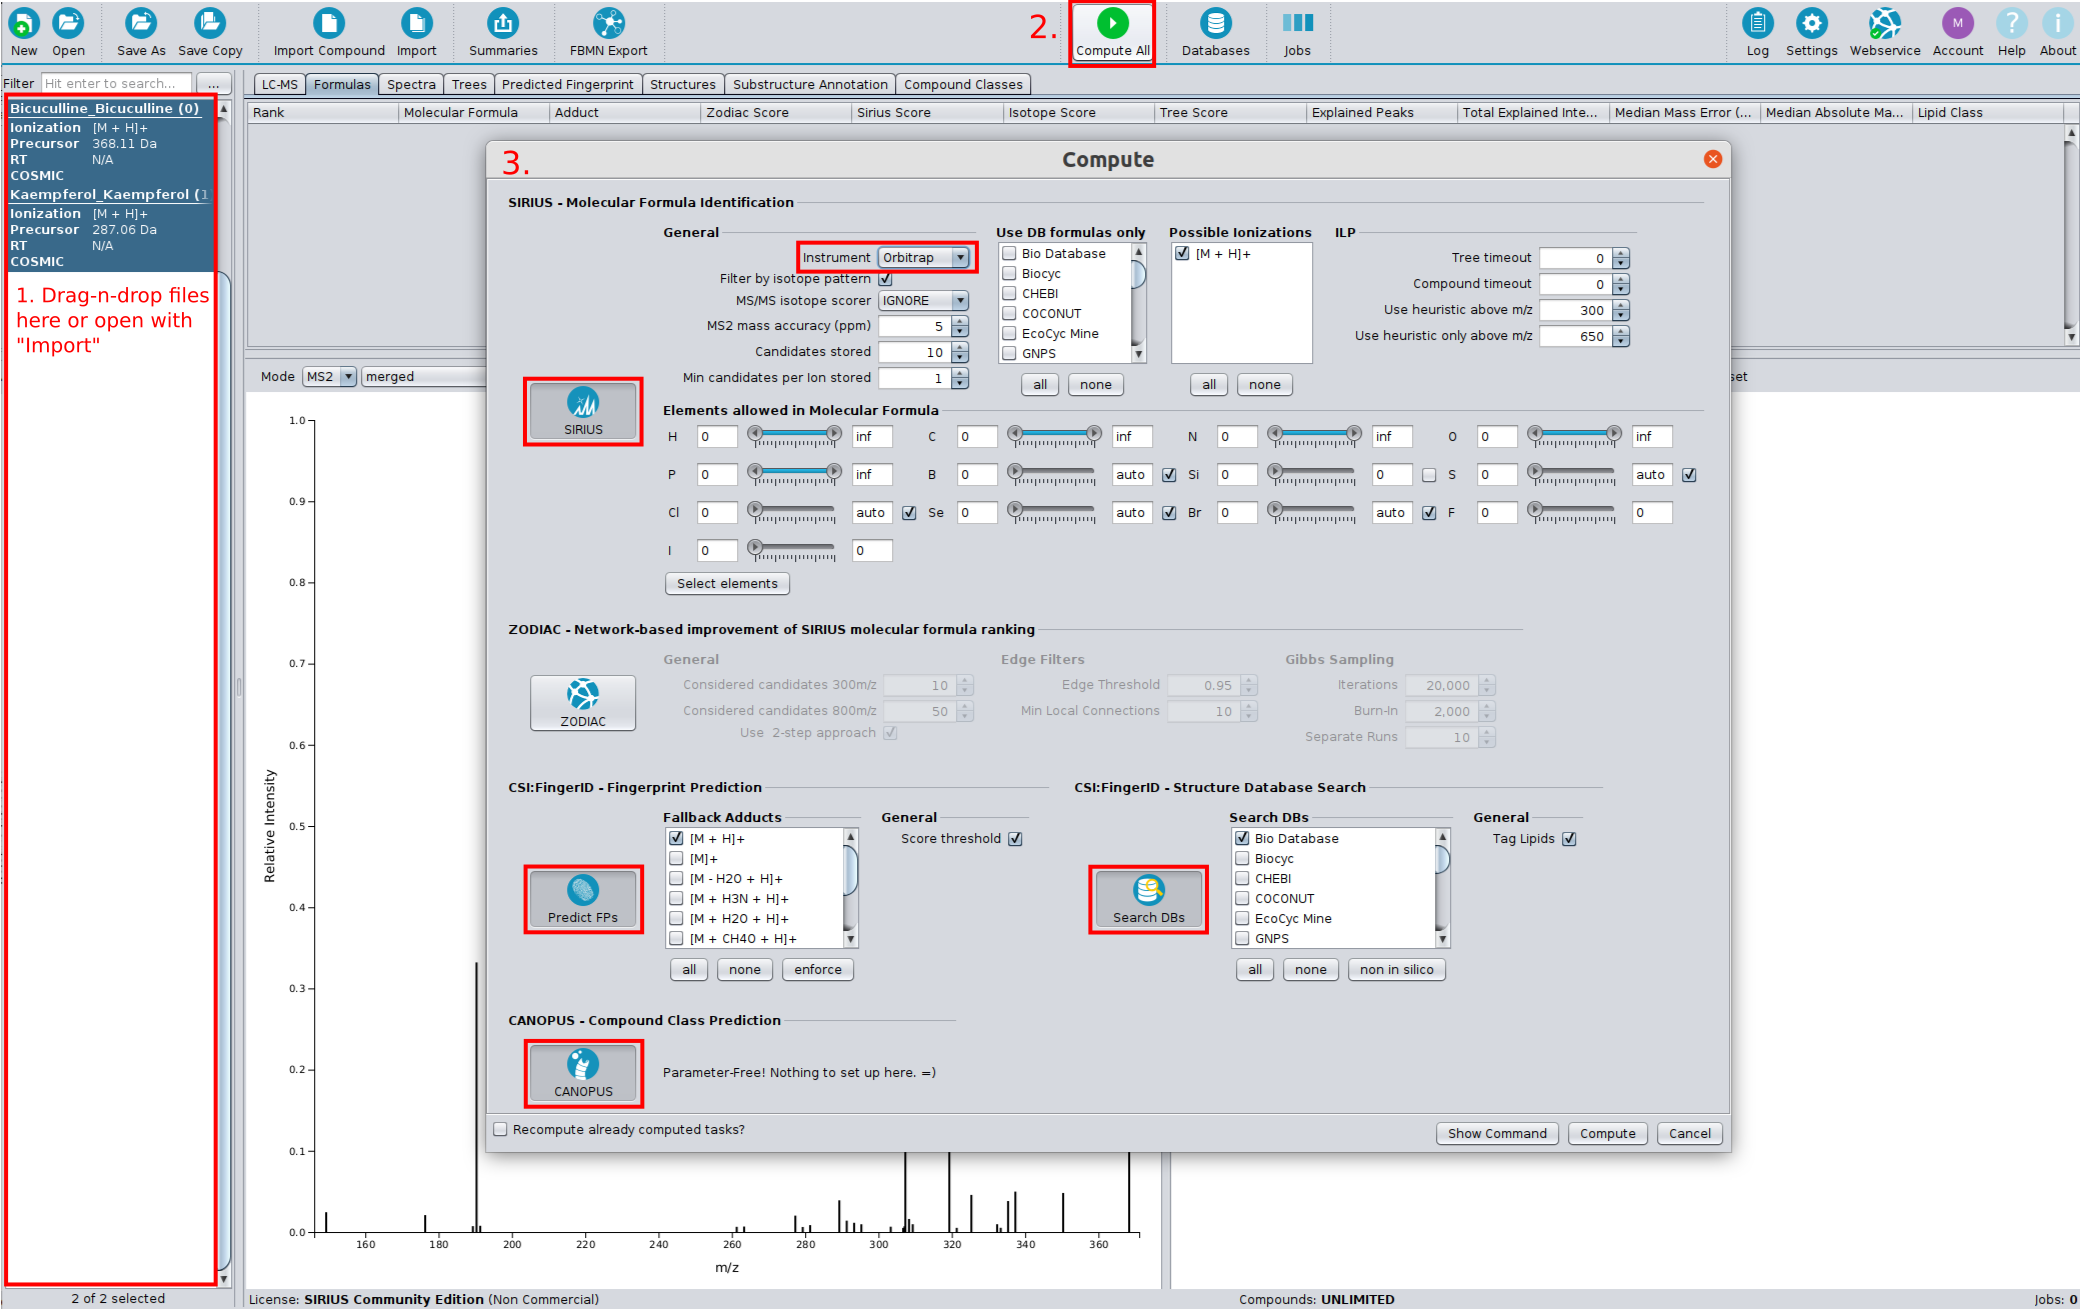
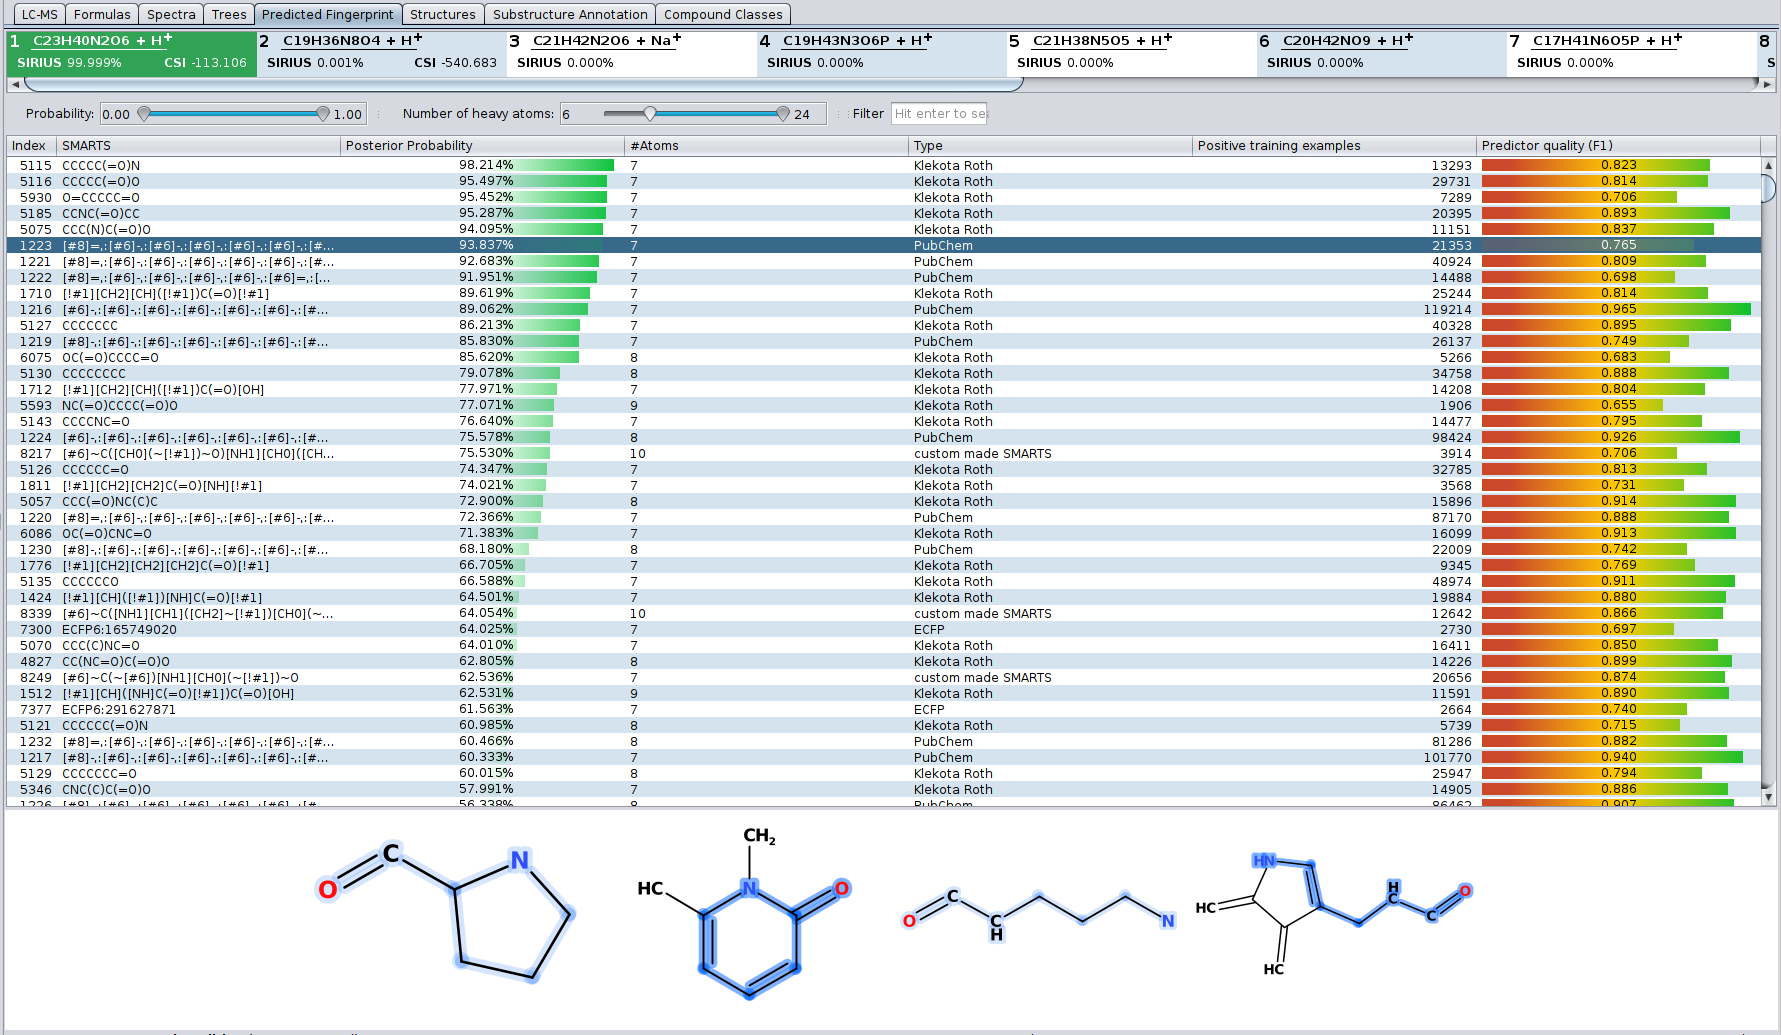
We are happy to announce that a major version upgrade of SIRIUS is available! Scroll to the bottom to get a visual impression of the changes.

SIRIUS 5 now includes the following new features and improvements:

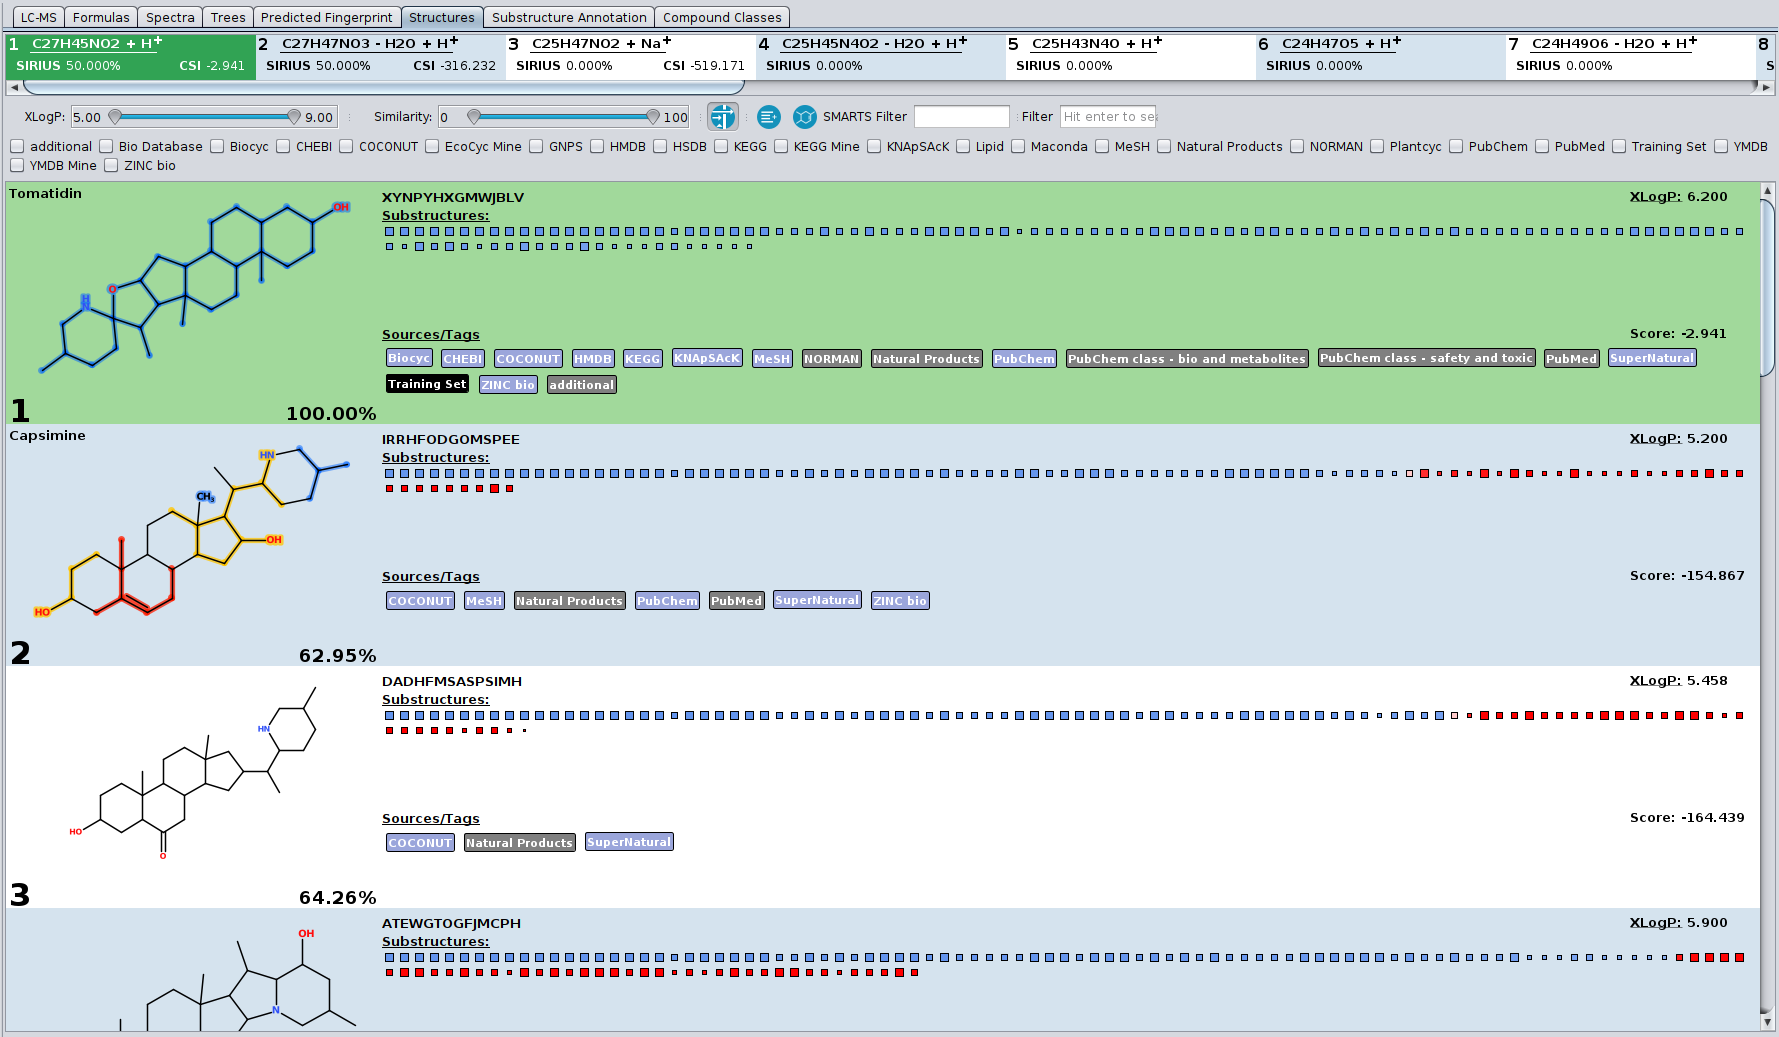
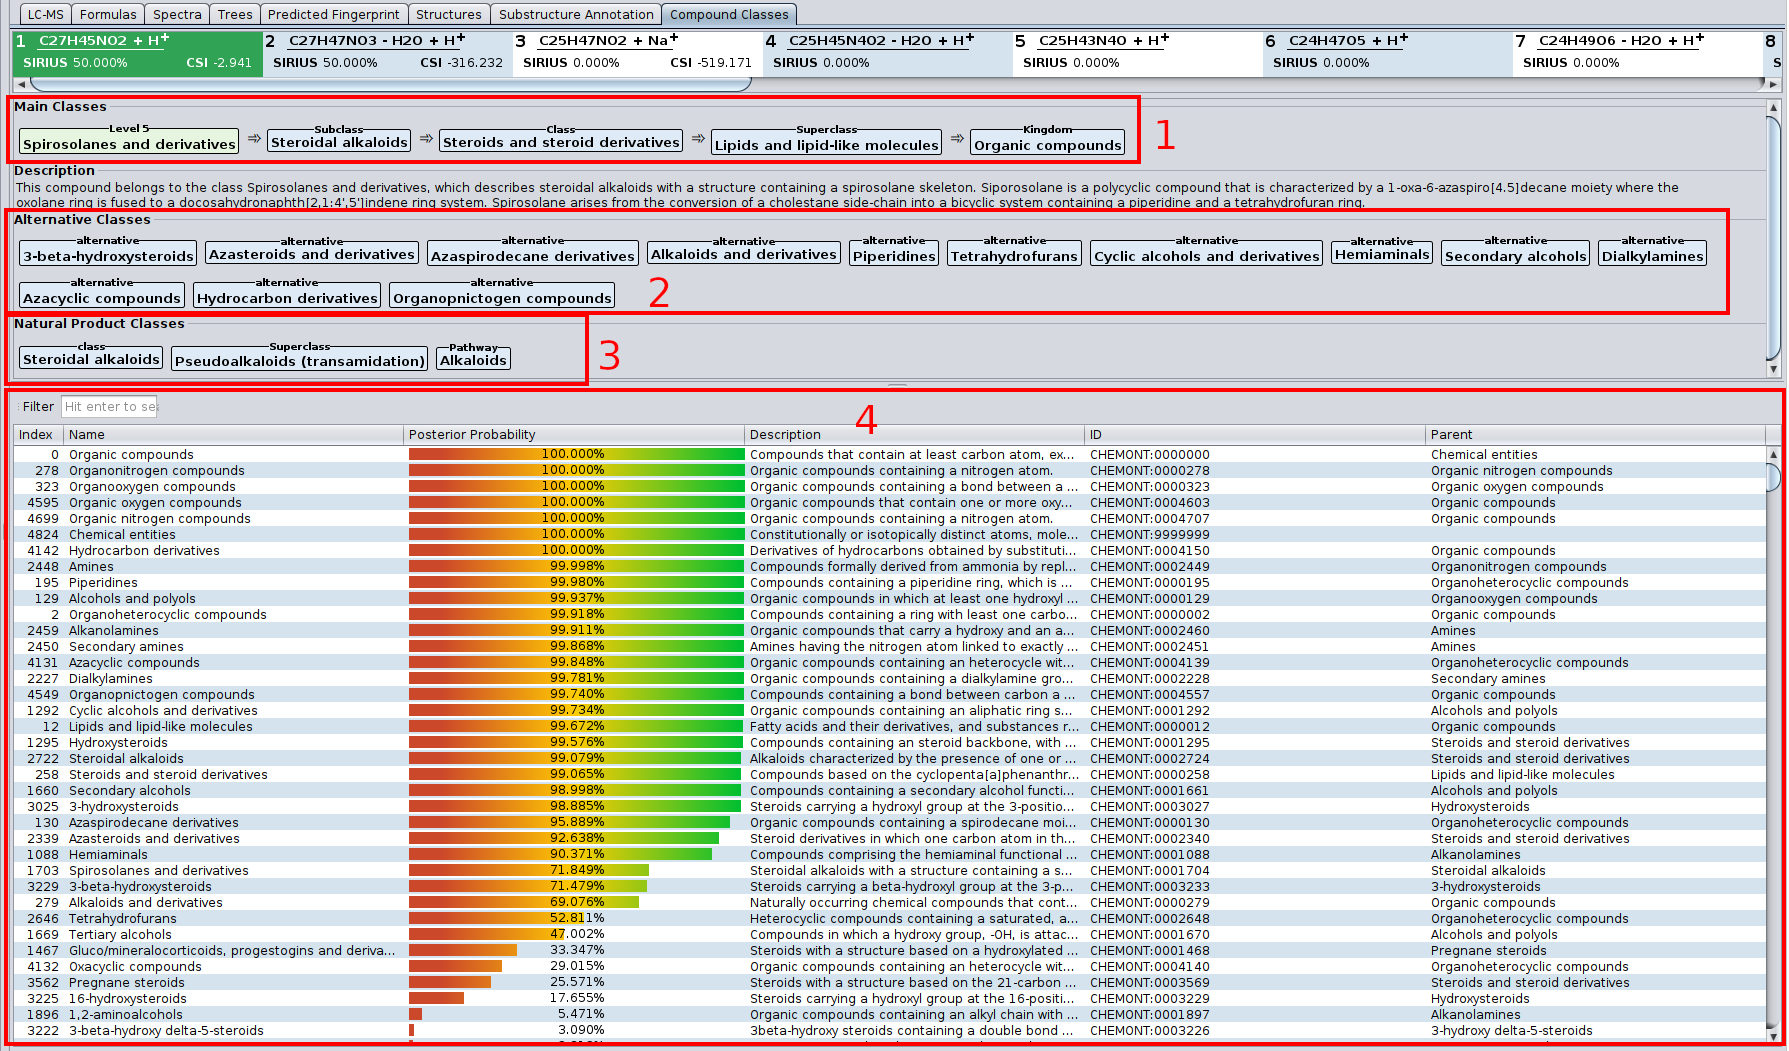
  • Lipid class annotation with El Gordo: Lipid structures that have the same molecular formula (usually belonging to the same lipid class) can be extremely similar to each other, often only differing in the position of the double bonds. These extremely similar structures may be even not differentiable by mass spectrometry at all. SIRIUS 5 now predicts the lipid class from the spectrum; when performing CSI:FingerID database search, all structure candidates that belong to this lipid class are tagged.
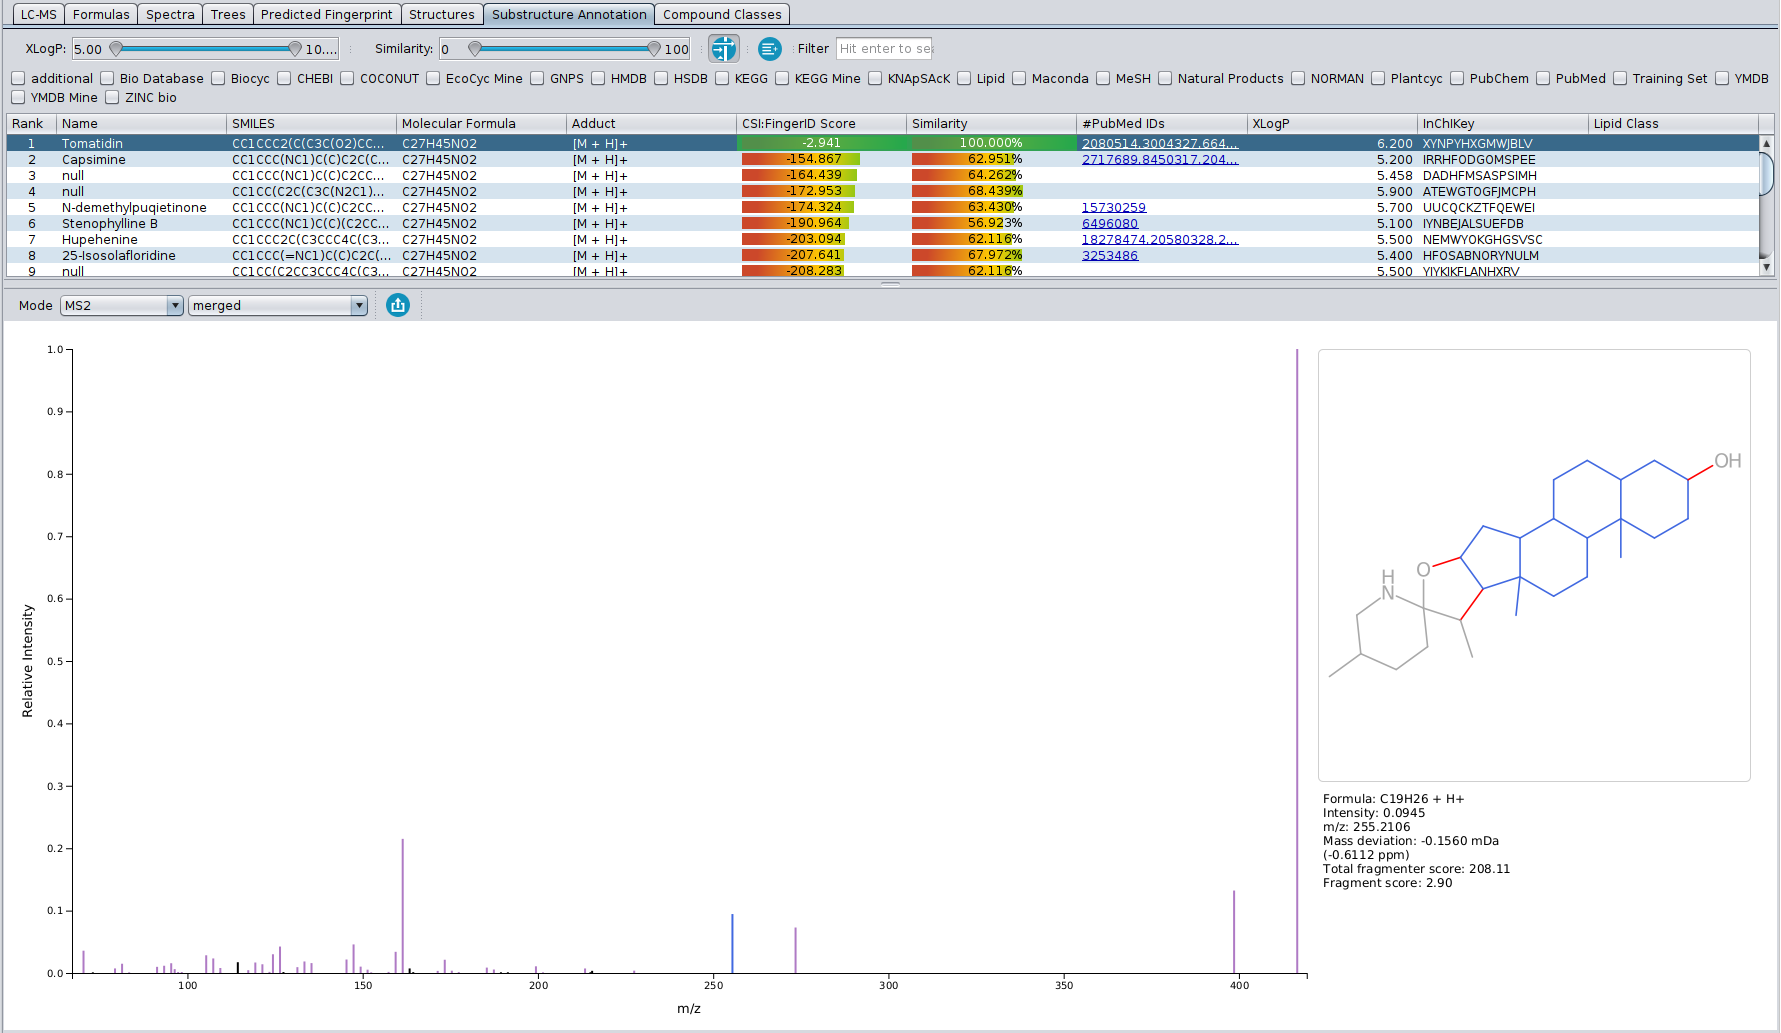
  • Sub-structure annotation with Epimetheus: For experimentalists, CSI:FingerID search may seem like a black box. If you want to perform manual validation of CSI:FingerID structure candidates, Epimetheus now provides a direct connection between structure candidates and your input MS/MS spectra. Sub-structures of the structure candidate of your choice are generated by a combinatorial fragmenter and assigned to peaks in the MS/MS spectrum. The new Epimetheus view allows you to directly visualize and inspect these sub-structure annotations.
  • Feature-rich spectrum viewer: Improved functionality of the SIRIUS spectrum viewer, including mirror plots of measured vs predicted isotope pattern.
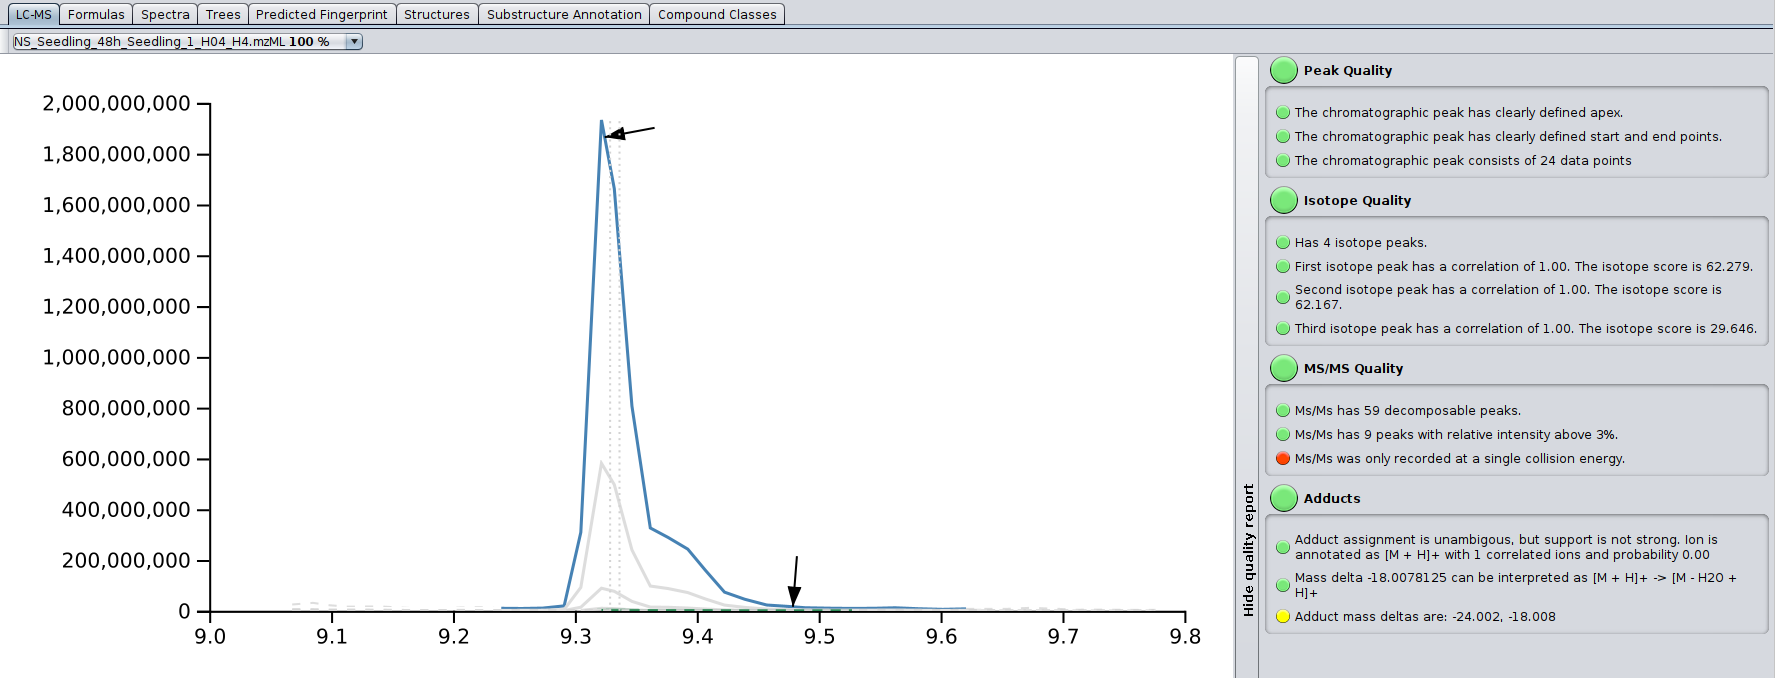
  • New LC-MS view: A new view in SIRIUS 5 that shows the extracted-ion chromatogram of a compound, including its detected adducts and isotopes. A traffic light allows for quick spectral quality assessment.
  • CANOPUS now fully supports Natural Product Classes (NPC).
  • Advanced filtering options on the compound list, including the new lipid class annotations.
  • Support for additional spectrum file formats (.msp, massbank, .mat)

If you were previously using SIRIUS 4, please be aware of the following breaking changes:

  • User authentication: A user account and license is now needed to use the online features of SIRIUS. The license is free and automatically available for non-commercial use. If your account is not automatically verified because your non-commercial research institution is not whitelisted yet, please contact us at
  • New project space compression: Method level directories are now compressed archives to reduce number of files and save storage.
  • Changed summary writing: Summary writing has been made a separate sub-tool (write-summaries). Summary files format has slightly changed. 
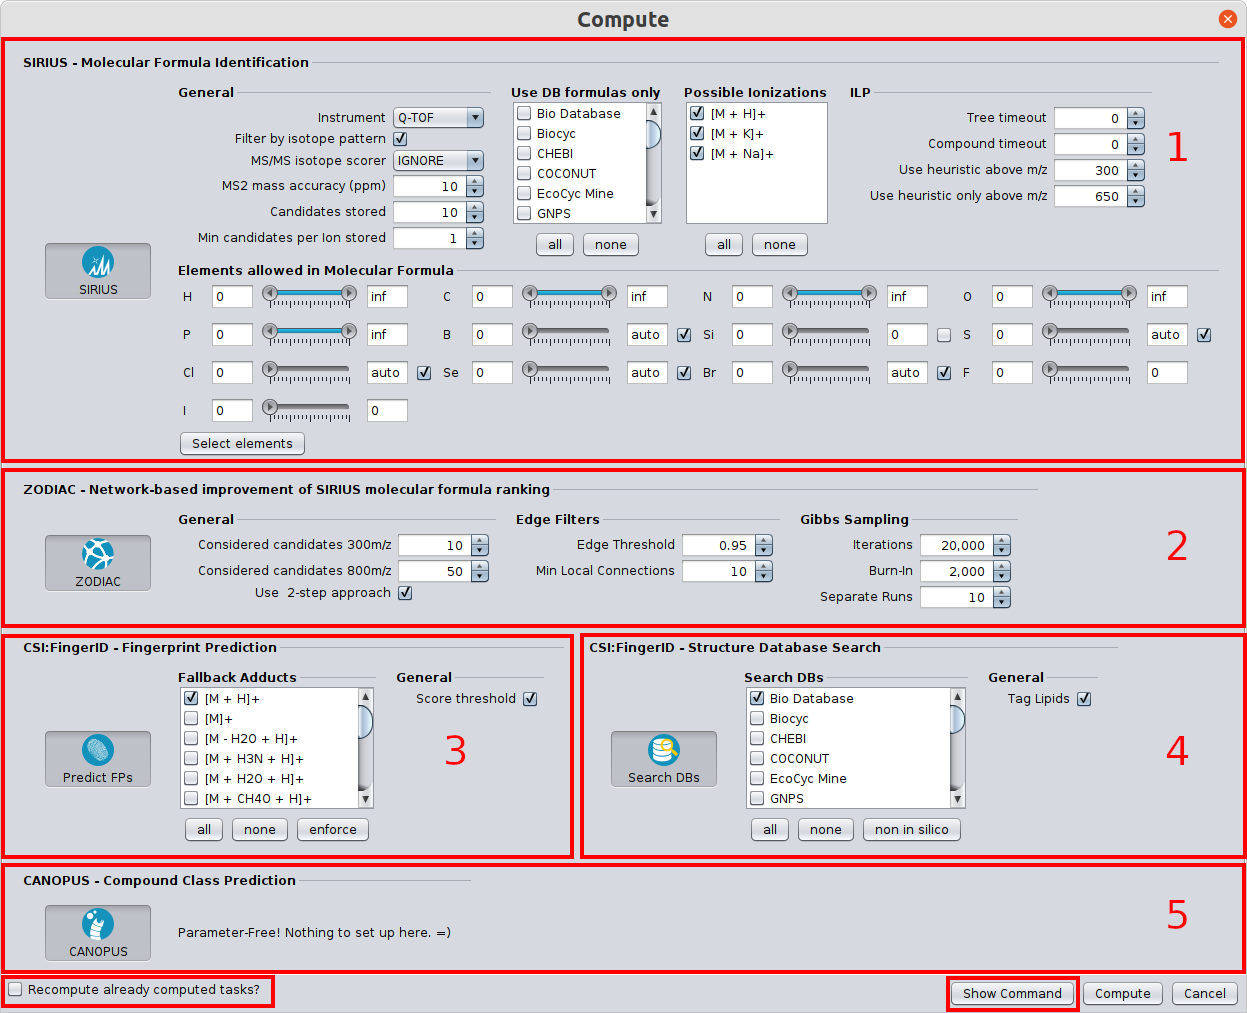
  • Prediction / DB search split: The fingerid/structure sub-tool has been split into a fingerprint (fingerprint prediction) and a structure (structure db search) sub-tool. This allows the user to recompute the database search without having to recompute the fingerprint and compound class predictions. It further allows to compute CANOPUS compound class prediction without having to perform structure db search.
  • Updated fingerprints: Updated fingerprint vector. Fingerprint related results of SIRIUS 4 projects may have to be recomputed to perform certain analysis steps (e.g. recompute db-search). Reading the projects is still possible and formula results are not affected.
  • Custom database format change: Custom database format has changed. Custom databases need to be re-imported.
  • GUI column rename: Some views in the GUI have been renamed to better reflect their position and role in the workflow.

For a quick overview on these new features and changes, visit our YouTube channel. Please refer to our online documentation for a more comprehensive overview and help us squash all remaining bugs by contributing at our GitHub!


Chair is awarded Thuringian Research Prize 2022 for applied research

Today (06 April), Prof. Sebastian Böcker, Dr. Kai Dührkop, Dr. Markus Fleischauer, Dr. Marcus Ludwig and Martin Hoffmann were awarded the Thuringian Research Prize 2022 for applied research. This was announced by Thuringia’s Science Minister Wolfgang Tiefensee in a video presentation. The price recognizes the development of machine learning methods for identifying small molecules, including CSI:FingerID, COSMIC and CANOPUS. These methods can be used via our software SIRIUS.

We feel very honored.

You can find the official announcement here.
The press release from Friedrich Schiller University Jena is here.

Thuringian Research Award. Image: Jens Meyer (University of Jena)
Group photo. Prof. Sebastian Böcker holds the prize in his hands. Image: Jens Meyer (University of Jena)

Why we do not use metascores

…and why you should also be very careful when doing so

Hi all, I (Sebastian) have recorded a talk about metascores which is now available from our YouTube channel at https://www.youtube.com/watch?v=mkfG6-ZqD0s. With “metascores”, I mean scores that are not based on the actual data (or metadata!) but rather on side information such as citation counts or production volumes of metabolites. See below for the distinction between metascores and metadata.

I have been thinking about recording such a talk for several years now. I never did, partly because I hoped that this topic would “go away” without me doing such a video. I was wrong, metascores are still in much use today. The other reason not recording the talk was that the more I thought about metascores, the more problems came into my mind. So, I added more slides to the talk, and then I had to re-record the talk, and so on ad infinitum. I now present six problems in the video; I decided I better record it before a seventh problem pops up.

I want to make clear that there is nothing bad with metascores as long as you are using them for a confined application: That is, you want to identify one particular feature in your LC-MS run, and for that you need some candidate compounds to get things started. If this is what you are after, and the actual identification is performed by an independent method (say, buying a commercial standard and doing a spike-in experiment) then you can generate the sorted list of candidates by any method that suits you; that clearly includes metascores. But as soon as you are doing “untargeted metabolomics” or anything similar to that, and as soon as you are using annotations of an in silico method to derive downstream information, you are in trouble — as explained in the video.

I discuss six problems of metascores in the talk, and I thought I will also shortly discuss them here. But first, let us discuss metascores vs. metadata.

Metascores vs. metadata

I previously had some discussions about metascores, and I have come to believe that some people think highly of metascores because of the connection to metadata. Well, point is, this is merely a misunderstanding. Metascores and metadata have nothing in common but the prefix “meta”. Metadata is data about your data; it is already used by in silico methods, be it the mass accuracy of the measurement or the ion mode. Metascores — at least the ones I am aware of — use side information, information which has nothing to do with the actual experiment you are conducting. See here for details. Side note: Using such side information (priors) has been discussed repeatedly in other fields such as transcriptomics or proteomics, but has been abandoned everywhere else many years ago.

1st problem: Blockbuster metabolites

This is potentially the biggest single issue of metascores: You will annotate the same metabolites again and again. They are simply “so much cooler” than everything else that a method can basically ignore the data. Who will not love to watch another blockbuster movie? And who will not love to annotate another blockbuster metabolite? See here for details.

2nd problem: Evaluation results are misleading

This is not so much a problem of metascores, but one that is caused by the interplay of metascores and the data we use for evaluations. In short, do not trust evaluations of metascores; the data used for evaluating them are basically from blockbuster metabolites. Which metascores will then correctly annotate, because they love to annotate blockbuster metabolites, and only blockbuster metabolites. See here for details.

3rd problem: Obfuscating good search results

When I say that metascore methods can basically ignore the MS/MS data, this is not as good as it may sound. These methods will obfuscate high-quality search results of an in silico method, and make it impossible for you to decide whether or not a particular search result is worth to follow up on. This issue gets dramatic if you use annotations to generate, say, statistics about the sample. In short: Never do any further analysis on annotations when a metascore was in play. See here for details.

4th problem: Why are you using MS/MS anyways?

It turns out that using a metascore, you can actually forget about MS/MS data; in evaluations, this data are no longer needed to reach good annotation rates. Isn’t that great news: We can do untargeted metabolomics and get away with LC-MS data, saving ourselves the troubles of recording MS/MS data at all! A classical win-win situation: Faster measurements and untargeted metabolomics. Citing Leonard Hofstadter: “Our babies will be smart and beautiful.” See here for details.

5th problem: You are not searching where you think you are

This problem makes me nervous, personally. We are basically saying we are searching throughout the whole planet Earth when in fact, we are searching only in our apartment. I doubt that I can get across the implications of doing so; but this is a horror for reproducibility, method disclosure etc. See here for details.

6th problem: Overfitting

But citations are a reasonable feature for compound annotation, right? And, metascores using citation numbers improve search results, right? Doesn’t that mean something? Short answer: No. We can also reach excellent search results with a metascore that is using moonstruck features such as “number of consonants in the PubChem synonyms”. See here for details.

I also have a few suggestions how I would proceed, instead of using a metascore. I am convinced that these suggestions are not the final word; rather, they are meant as a starting point.

Hope this talk helps to clear the perception of this particular computational method. Best regards, Sebastian.

COSMIC has appeared in Nature Biotechnology

Our article “High-confidence structural annotation of metabolites absent from spectral libraries” has just appeared in Nature Biotechnology. Congrats to Martin and all co-authors!

In short, COSMIC allows you to assign confidence to structure annotations. For every structure annotated by CSI:FingerID, COSMIC provides a confidence score (a number between 0 and 1) that tells you how likely it is that this annotation is correct. This is similar in spirit to what is done in spectral library search: Not only is the cosine score used to decide which candidate best fits to the query spectrum; in addition, we use the cosine of the top-scoring candidate (the hit) to decide whether it is likely correct (say, above 0.8), incorrect (say, below 0.6) or in the “twilight” in-between. If you have been using CSI:FingerID for some time, you might have noticed that finding such thresholds is not possible for the CSI:FingerID score. COSMIC closes this gap and tells you if an annotation is likely correct or incorrect.

Doing so is undoubtedly convenient in practice; but this is not what COSMIC is all about. What we can do now is to sort all hits in a dataset or even a repository with respect to confidence, and then concentrate our downstream analysis on high-confidence annotations. Next, we can replace the “usual” structure databases we search in by a structure database made entirely from hypothetical structures generated by combinatorics, machine learning or in silico enzymatic reactions.

We demonstrate COSMIC’s power by generating a database of hypothetical bile acid structures, combinatorially adding amino acids to bile acid cores, yielding 28,630 plausible bile acid conjugate structures. We then searched query MS/MS data from a mice fecal dataset in this combinatorial database, and used the COSMIC confidence score to distinguish between hits that are likely correct or incorrect. We manually evaluated the top 12 hits and found that 11 annotation (91.6%) were likely correct; two annotations were further confirmed using synthetic standards. All 11 bile acid conjugates are “truly novel”, meaning that we could not find those structures in PubChem or any other structure database (or publication). Whereas reporting 11 novel bile acid conjugates may appear rather cool, we argue it is even cooler that we did this without a biological hypothesis beyond “there might be bile acid conjugates out there which nobody knows about”; and that COSMIC found the top bile acid conjugate annotations in a fully automated manner and in in a matter of hours.

We have also annotated 2,666 LC-MS/MS runs from human samples with molecular structures which are currently absent from HMDB, and for which no MS/MS reference data are available; and finally, 17,414 LC-MS/MS runs with annotations for which no MS/MS reference data are available. We hope that some of them might be of interest to you.

If you have an idea of hypothetical structures, similar to the bile acid conjugates, to be searched against thousands of datasets, please let us know.

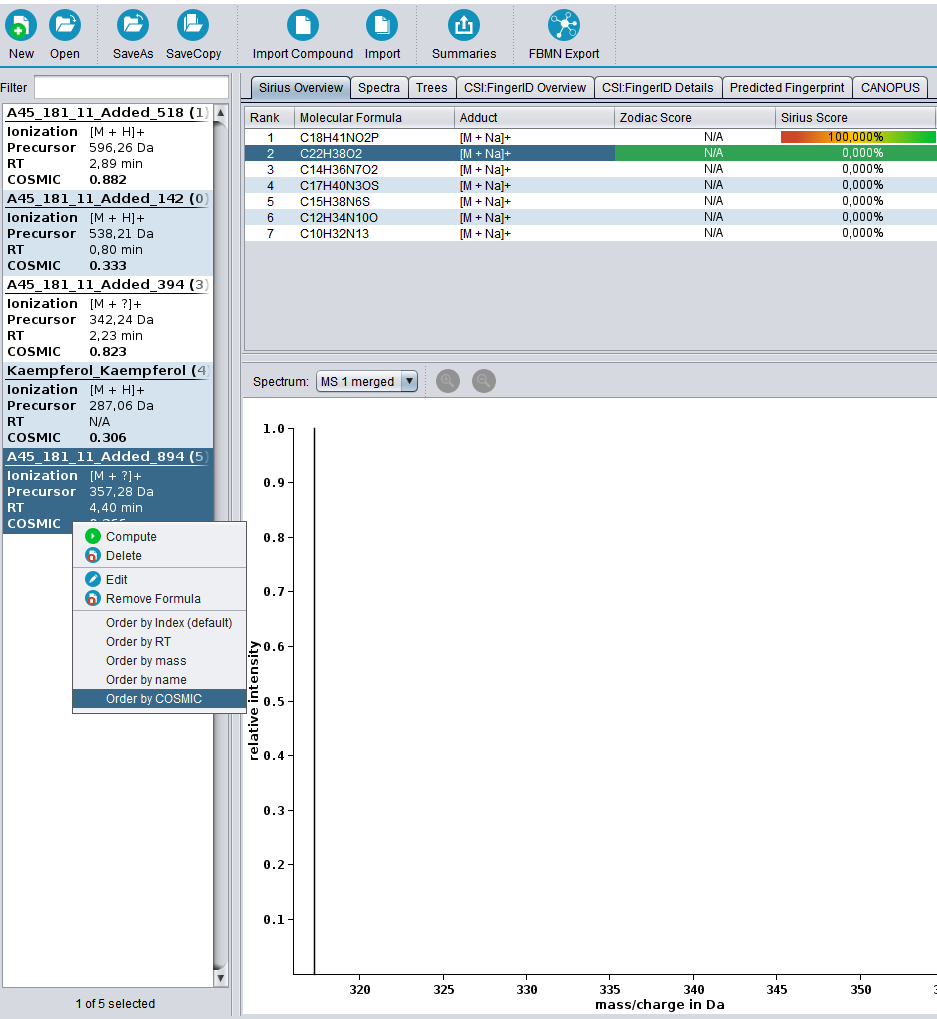
COSMIC’s confidence score is available through SIRIUS since version 4.8, download here.


Happy 25 million queries, CANOPUS!

We are fully aware that this post is far less interesting to you than it is to us; but sometimes, proud parents just have to do what proud parents have to do: CANOPUS has passed 25 million queries! Congratulations! Wow, that was fast, the preprint appeared on bioRxiv only 14 months ago.

In this context, we can also report that CSI:FingerID has surpassed 120 million queries. Which basically means we missed the round anniversary. We are bad parents; but kids are sometimes growing so quickly, you turn around and they are past 100 million queries.

Have fun with our tools!